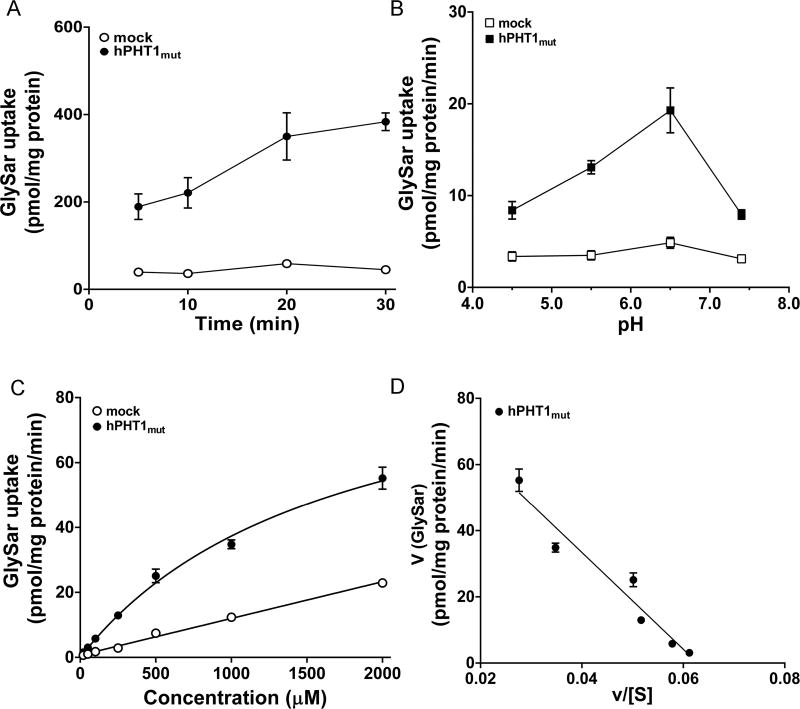
Figure 4.
Concentration-dependent uptake of GlySar in hPHT1mut cells. (A) Time-dependent uptake of 100 µM GlySar in hPHT1mut and mock cells at pH 6.5. (B) pH-dependent uptake of 100 µM GlySar in hPHT1mut and mock cells after 15 min incubations. (C) Concentration-dependent uptake of GlySar (20–2000 µM) in hPHT1mut and mock cells after 15 min incubations in MES buffer (pH 6.5). Uptakes of GlySar in mock cells were subtracted from the corresponding uptakes in hPHT1mut cells. (D) Eadie–Hofstee plot of GlySar uptake. Data are expressed as mean ± SE (n = 3).

