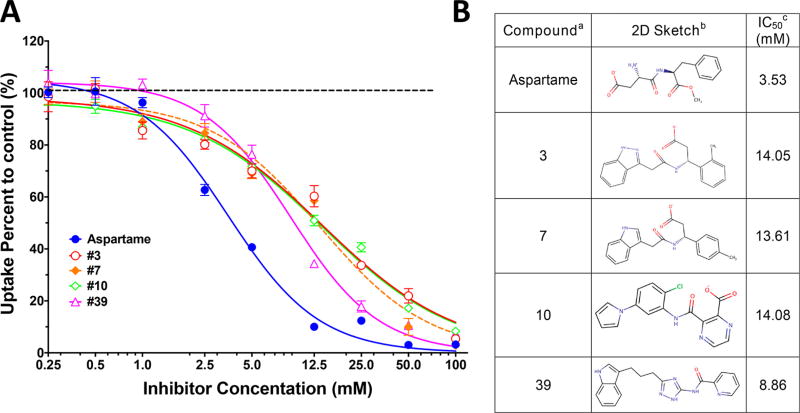
Figure 2.
Inhibition studies of five potential hPepT1 substrates on the uptake of GlySar. (A) 10 µM of 3H-GlySar was incubated with a series concentration of inhibitors at room temperature for 2 min, the percent uptake calculated (relative to control), and the results then fit to a dose-dependent inhibition model using Prism version 7.0 (mean ± SE, n = 3). (B) Experimentally confirmed ligands with (a) compound referring to the name of the compound; (b) 2D Sketch representing the two-dimensional structure of the compound; (c) IC50 referring to the experimental IC50 of each compound. The ranking of these compounds in their respective screens is provided in Table S1.

