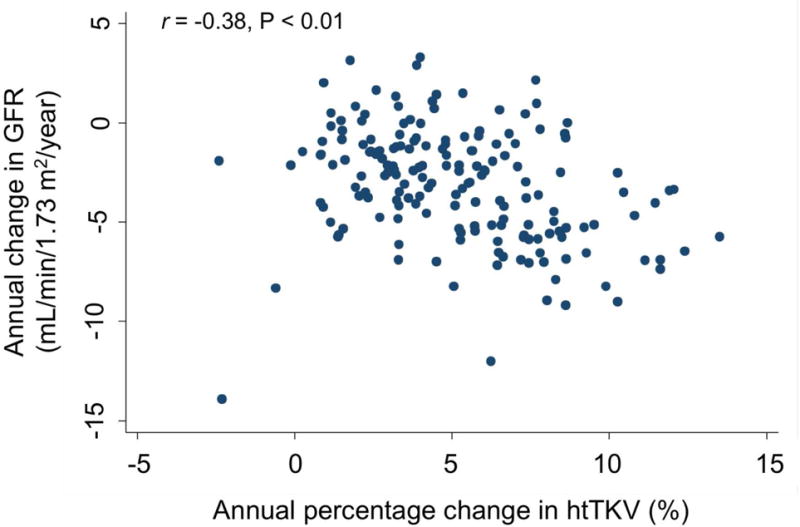
Fig. 3.

Scatter plots showing the correlation between annual percentage change in htTKV, determined over the course of the entire study (A) or using data from the first 4 years only (B), and the annual change in iothalamate GFR during the study. Spearman’s correlation coefficients (r) are shown.
