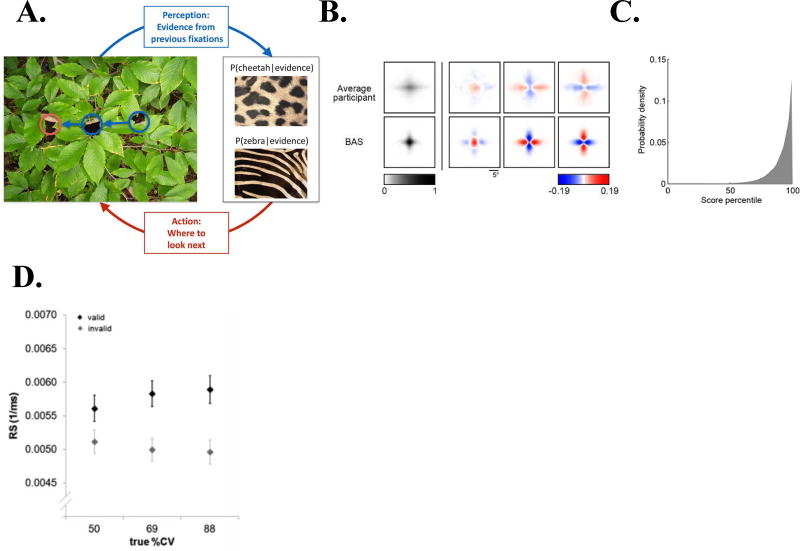
Figure 2. Behavioral measures of information-based policies.
(A–C) Saccadic sampling for a categorization decision (A) When trying to categorize whether a fur hidden behind foliage (left) belongs to a zebra or a cheetah, evidence from multiple fixations (blue, the visible patches of the fur, and their location in the image) needs to be integrated to generate beliefs about fur category (right, here represented probabilistically, as the posterior probability of the particular animal given the evidence). Given current beliefs, different potential locations in the scene will be expected to have different amounts of informativeness with regard to further distinguishing between the categories, and optimal sensing involves choosing the maximally informative location (red). In the example shown, after the first two fixations (blue) it is ambiguous whether the fur belongs to a zebra or a cheetah, but active sensing chooses a collinearly located revealing position (red) which should be informative and indeed reveals a zebra with high certainty. (B) Revealing density maps for participants and the BAS model. The first column shows mean reveal density and the last three columns show mean subtracted densities for each of the three underlying image types (patchy, horizontal stripes, vertical stripes). Bottom: color scales used for all mean densities (left), and for all mean-corrected densities (right). All density maps use the same scale, such that a density of 1 corresponds to the peak mean density across all maps. (C) Histogram showing the distribution of percentile values of informativeness (as derived by the BAS algorithm) across all participants, trials and fixations.
(D) Validity effects in a Posner cueing paradigm. The difference in mean response speed (RS, the reciprocal of RT) to detect targets that were validly vs invalidly cued increases as a function of the reliability of the cue (%cue validity, %CV). Reproduced with permission from Yang et al., 2016 (A–C) and Vossel et al., 2015 (D).

