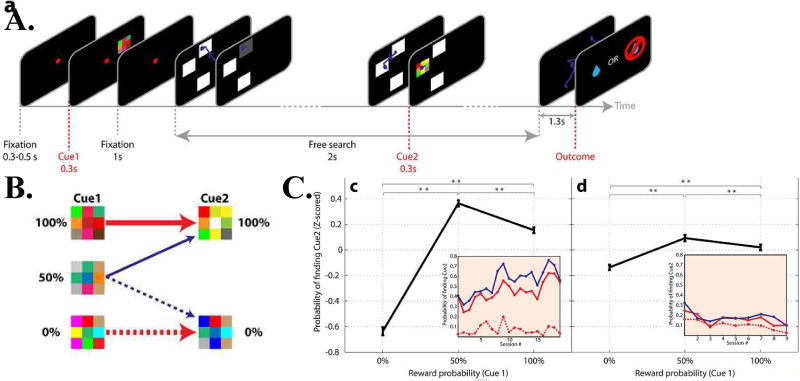
Figure 5. Non instrumental search behavior.
(A) Task stages. The monkey initiated each trial by fixating a central point and maintaining gaze on it while cue1 was shown in the periphery for 0.3 s. After an additional second, the fixation point was replaced with a search display containing 3 white masks that the monkey could freely scan. If the monkey maintained gaze on a mask for 300 ms, this triggered a reveal of the underlying pattern (a gray square or an additional cue). In the example illustrated, the monkey first uncovered an uninformative gray square and later found cue 2 at the middle location. The search display then disappeared, and after an additional 1.3 s delay (blank screen) the trial ended with a tone that was accompanied by the outcome (a reward or a lack of reward according to the probability signaled by cue 1). The search behavior was entirely unconstrained and had no bearing on the final outcome.
(B) Transition statistics between cue 1 (which could signal 0%, 50% or 100% reward likelihood) and cue 2 (which signaled a 0% or 100% probability). If cue 1 signaled 100% or 0% reward, cue 2 merely confirmed this prediction, bringing no new information. If cue 1 signaled a 50% reward likelihood, cue 2 brought new information, and was equally likely to signal a positive or a negative outcome.
(C) The probability of finding cue 2 as a function of the prior probability signaled by cue 1, for two subjects (right and left panels). Points show the mean and standard errors of these probabilities, z-scored across all sessions. Stars indicate p < 0.025 (Wilcoxon test). The insets in each panel show the average of the raw data per session. The dotted red trace indicates 0% cue 1, the solid red trace shows 100% cue 1 and the solid blue trace shows 50% cue 1. Reproduced with permission from Daddaoua et al., 2016.

