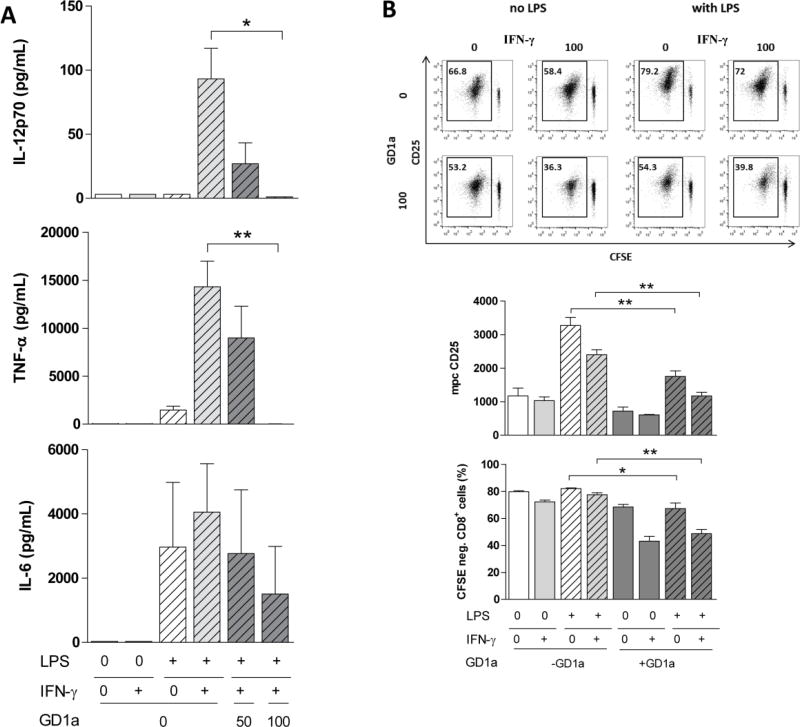
Figure 2. DC exposure to GD1a abrogates LPS-stimulated pro-inflammatory cytokine secretion and inhibits allogeneic T-cell responses, not reversed by IFN-γ.
(A) DCs were stimulated as in Figure 1. Cell culture supernatants were analyzed for the cumulative release of IL-12p70, TNF-α, and IL-6. Bars indicate mean±SEM of triplicate cultures in one representative of three similar experiments. (B) DCs cultured and illustrated as in Figure 1, were washed, and then used to stimulate CFSE stained allogeneic T-cells at a DC:T-cell ratio of 1:10. The allogeneic proliferative response of live CFSE-stained CD3+CD8+ lymphocytes was assessed after 7 days of co-culture. The percent CFSE-negative cells and the mpc of CD25 were quantified by flow cytometry as exemplified in a representative experiment shown in Fig. 1B, top panel. Bars indicate mean±SEM combining four cultures of two separate experiments. Proliferation controls: resting T-cells, 0.36% CFSE negative; T-cells stimulated with anti-CD3/anti-CD28 antibodies, 93.6% CFSE negative (Data not shown). *, P<0.05; **, P<0.01, ***, P<0.005 analyzed using a two-tailed Student’s t test.

