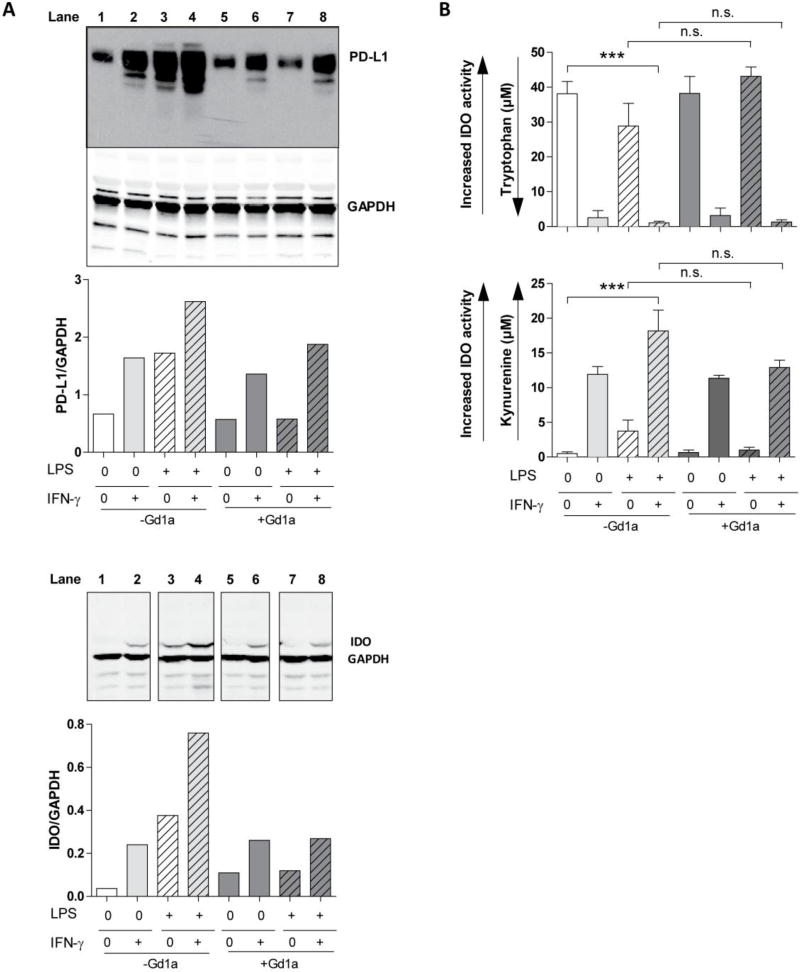
Figure 3. PD-L1 expression and IDO1 protein induction and activity by IFN-γ is resistant to GD1a pre-exposure of DCs.
(A) DCs were cultured as in Fig. 1. At the end of culture, PD-L1 (top panel) and IDO1 (lower panel) protein expression was examined by Western blot and quantified by ImageJ; bars indicate relative PD-L1 or IDO1 expression, shown as the PD-L1/GAPDH or IDO/GAPDH ratio. One representative of two separate experiments with similar results is shown. (B) Cell culture supernatants of DCs cultured as in (A) were analyzed for tryptophan and kynurenine concentration to determine IDO1 activity. Increasing IDO1 activity is seen as reduction in tryptophan and increase in kynurenine concentration. Bars indicate the mean ±SEM of triplicate cultures in a representative of three separate experiments. ***, P<0.0005, n.s. not significant analyzed using unpaired two-tailed Student’s t test.

