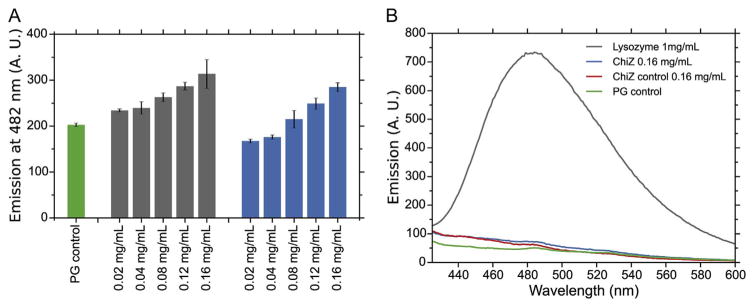
Fig. 2.
M. tuberculosis peptidoglycan fluorescence hydrolysis assay. Hydrolysis assay was performed using fluorescamine labeled PG. Fluorescence emission of soluble fragments was measured at 482 nm. (A) Experiments were performed with different concentrations of ChiZ (grey bars). Control experiments were performed without protein (green bar) and without substrate (blue bars). All experiments were performed in triplicate. (B) Fluorescence emission spectra obtained for the peptidoglycan only control (green), lysozyme positive control (1 mg/mL) (Grey), ChiZ only control (0.16 mg/mL) (Red), and peptidoglycan treated with ChiZ (0.16 mg/mL) (Blue).

