
Figure 2.
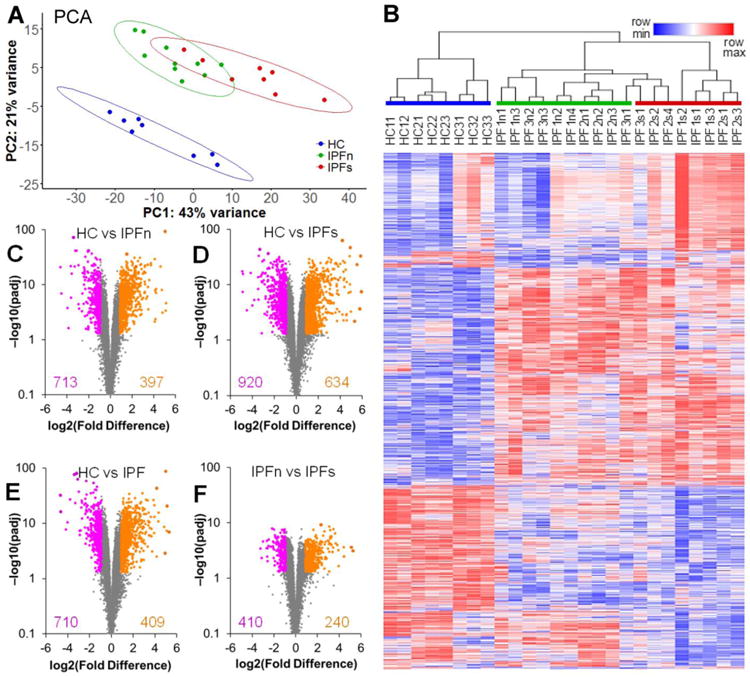
Overview of the differential expression of genes between lung tissue samples from patients with IPF and healthy controls. A. Two-dimensional principal component analysis of the RNASeq transcriptome dataset for lung tissue samples in this study reveals a clear separation of the samples from healthy controls (HC) and samples from patients with IPF. The separation of IPF samples from macroscopically normal-appearing (IPFn) and scarred (IPFs) areas is less pronounced, with some overlap present. Data ellipses for sample groups are plotted assuming a t-distribution at the confidence level 0.90 B. Unsupervised clustering of log2-transformed normalized counts (see Supplementary Dataset 1 for numerical values), using Spearman rank correlation with average linkage, of tissue samples based on 2,099 differentially expressed genes (see text for selection criteria). The genes themselves were also clustered using the same procedure. Note the varying extent of overlap between the sample groups (HC, IPFn, and IPFs highlighted with colored bars above the sample labels) and the clusters: the HC samples clustered separately from the IPF samples, whereas some of the IPFs samples clustered together with the IPFn. C-F. Volcano plots [−log10(padj) vs log2(Fold Difference)] of genes in the HC vs IPFn (C), HC vs IPFs (D), HS vs IPF combined (E), and IPFn vs IPFs (F) comparisons. The total numbers of genes meeting the selection criteria for elevated (purple) or reduced (orange) expression are indicated in each panel. See Supplementary Tables 3-6 for numerical values of RNASeq counts for differentially expressed genes in each of these of these comparisons.