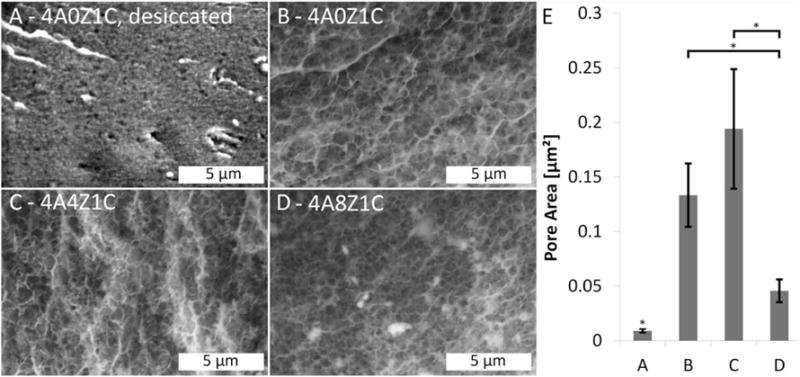
FIGURE 3.

SEM imaging of pores. A SEM image of a (A) 4A0Z1C, dried via desiccation; displaying relatively small pore size, (B) 4A0Z1C, displaying relatively large pore size, (C) 4A4Z1C, displaying a relatively large pore size and, (D) 4A8Z1C, displaying moderate pore size. (E) Average pore size of the corresponding compositions A–D calculated using image analysis of SEM images as described in the methods. For this analysis, images were divided into quadrants and analyzed one quadrant at a time in ImageJ. Images were converted to 8-bit format, and the background correction plugin was applied, followed by image sharpening and conversion to a binary image. Pore area was then determined using the particle analysis tool, with a threshold area of 0.002 μm2 used to account for noise. Error bars show standard error. * indicates p < 0.05 compared between groups.
