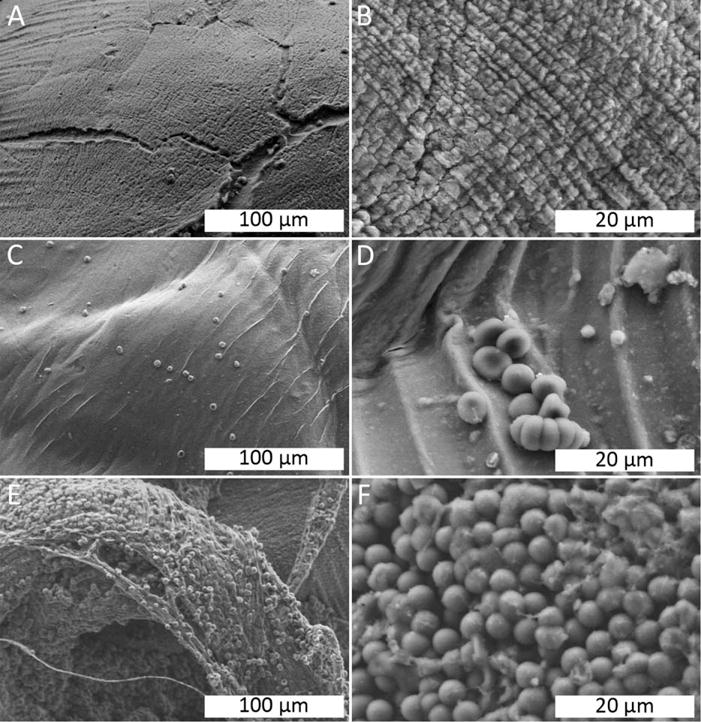
FIGURE 4.

SEM imaging of beads in citrated whole blood. (A) 4A0Z0C, showing minimal cell adhesion. (B) 4A0Z0C, showing a striated surface, but no cell adhesion. (C) 4A0Z1C, showing a smooth surface and sparse amounts of erythrocyte adhesion. (D) 4A0Z1C, showing a small cluster of erythrocytes adhering to the bead’s surface. (E) 4A4Z1C, showing complete coverage of erythrocytes on the surface of the bead along with the presence of fibrous structures. (F) 4A4Z1C, showing a layer of erythrocytes covering the bead’s surface.
