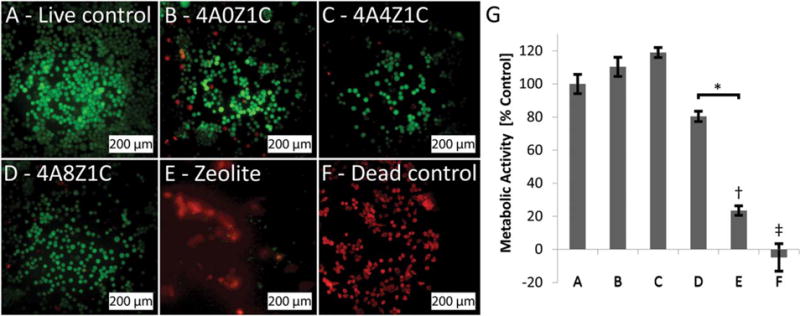
FIGURE 7.

Live/Dead and MTS of murine fibroblast L929 cells. Dead cells fluoresced red against live cells, which fluoresced green. (B) 4A0Z1C beads, (C) 4A4Z1C beads, (D) 4A8Z1C beads, and (E) plain zeolite as purchased, are compared to a (A) live control and (F) dead control. Metabolic activity measured by an MTS assay and presented as percent of live control (G) for murine fibroblast L929 cells exposed to each corresponding material composition. * indicates p < 0.05 for group D compared with group E. †indicates p < 0.01 for group E compared with all other groups except for group F. ‡ indicates p < 0.001 for group F compared with all other groups except for group E.
