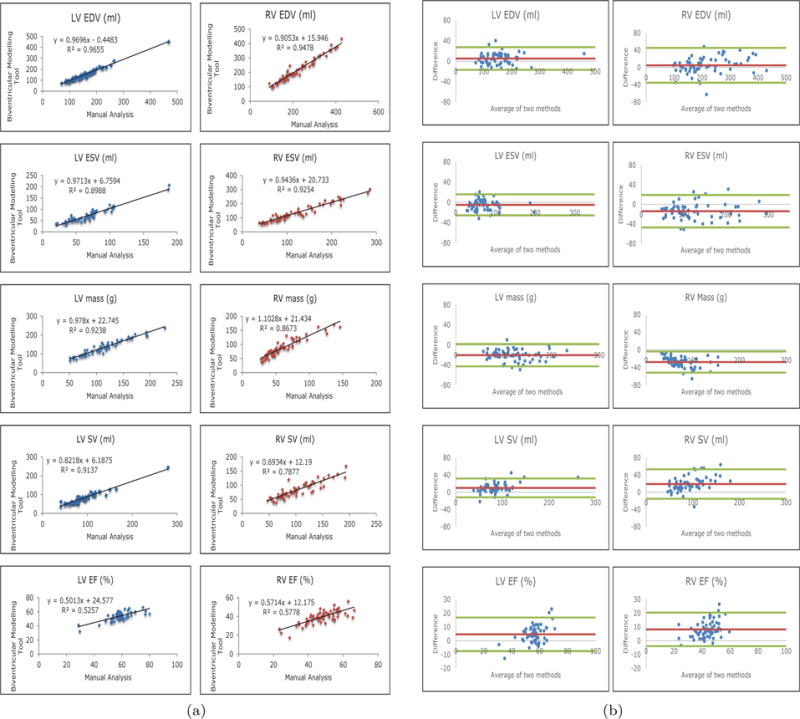
Fig. 6.

(a) Regression plots showing the correlation between the two measurement methods. (b) Bland-Altman plots comparing the correlation of the manual results and the biventricular modelling tool. The average difference is shown in red and 2 standard deviations are shown in green.
