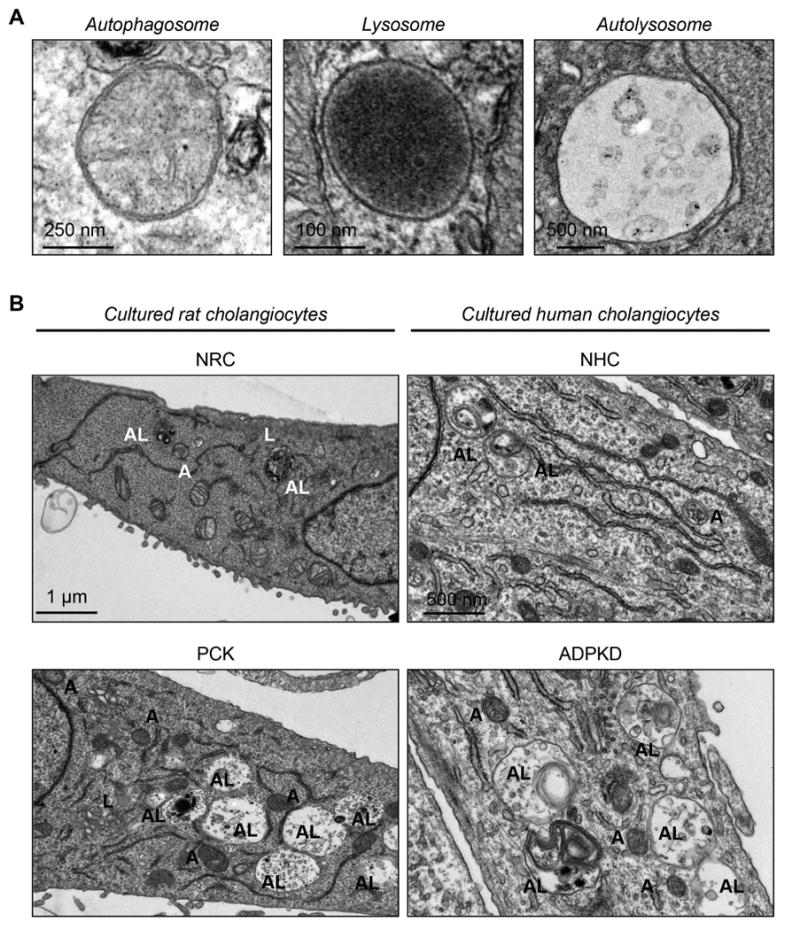
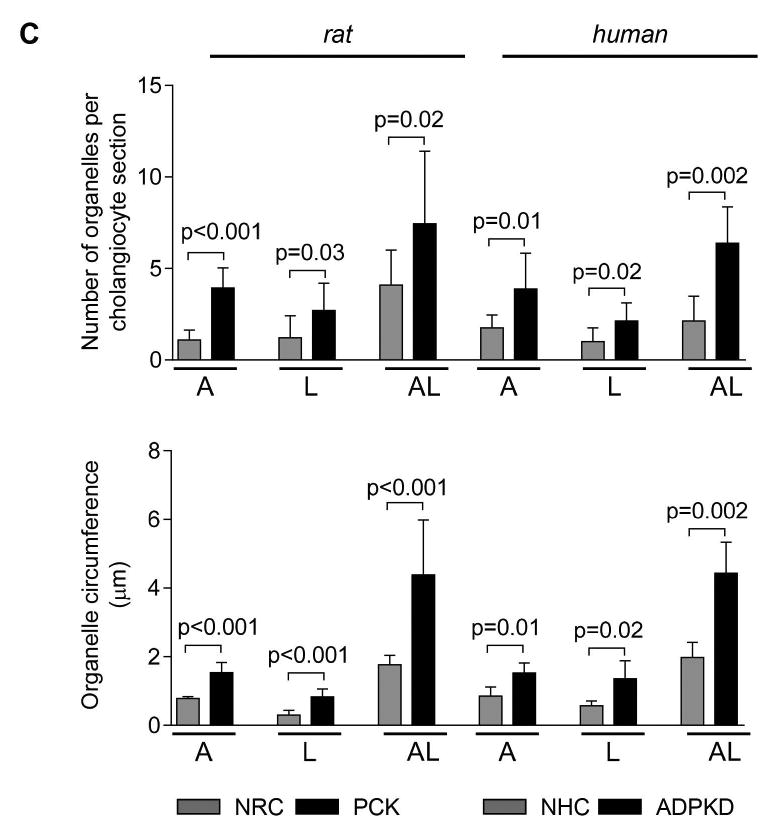
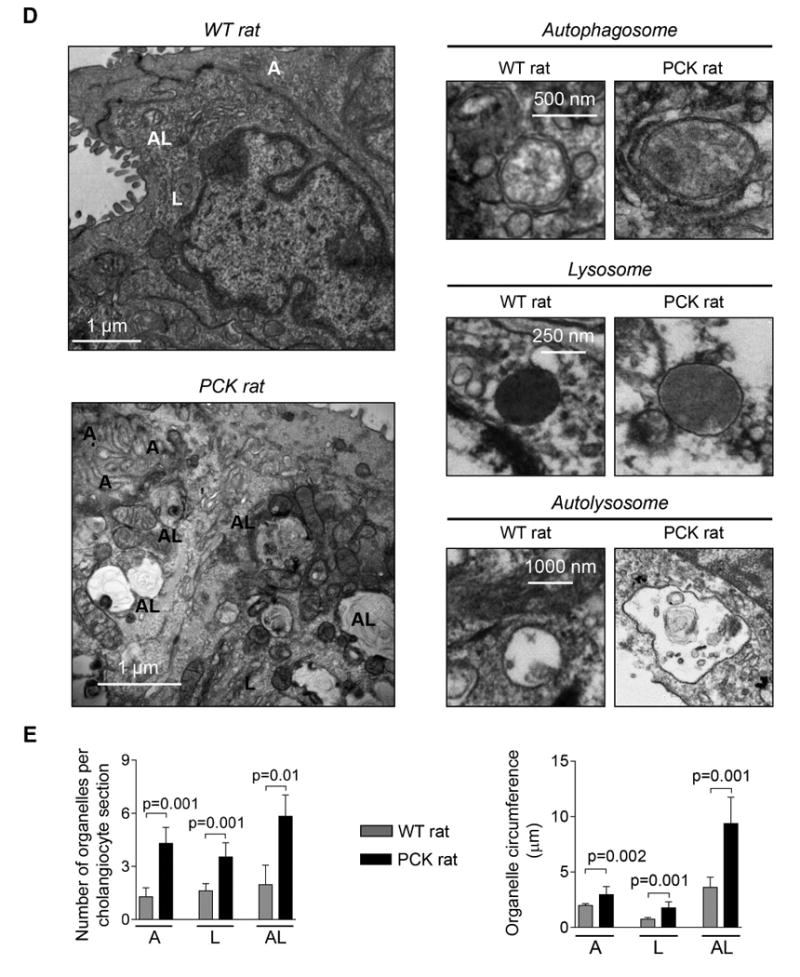
Figure 2. The number and size of autophagosomes, lysosomes and autolysosomes are increased in PLD cholangiocytes.


(A) Representative TEM images of rat cholangiocyte autophagosomes, lysosomes and autolysosomes. (B) Representative TEM images and (C) bar graphs demonstrate that the number and size of autophagosomes, lysosomes and autolysosomes are greater in cultured PCK rat and human ADPKD cholangiocytes compared to NRC and NHC, respectively. n=30 cholangiocyte sections for each experimental condition. (D) Representative TEM images and (E) bar graphs show an increase in the number and size of organelles in cholangiocytes lining liver cysts in PCK rats compared to cholangiocytes of WT rats. Five liver sections from each three WT rats and five PCK rats were analyzed. Data are presented as MEAN±SD. Abbreviation: A - autophagosome, L – lysosome, AL – autolysosome, WT – wild type.
