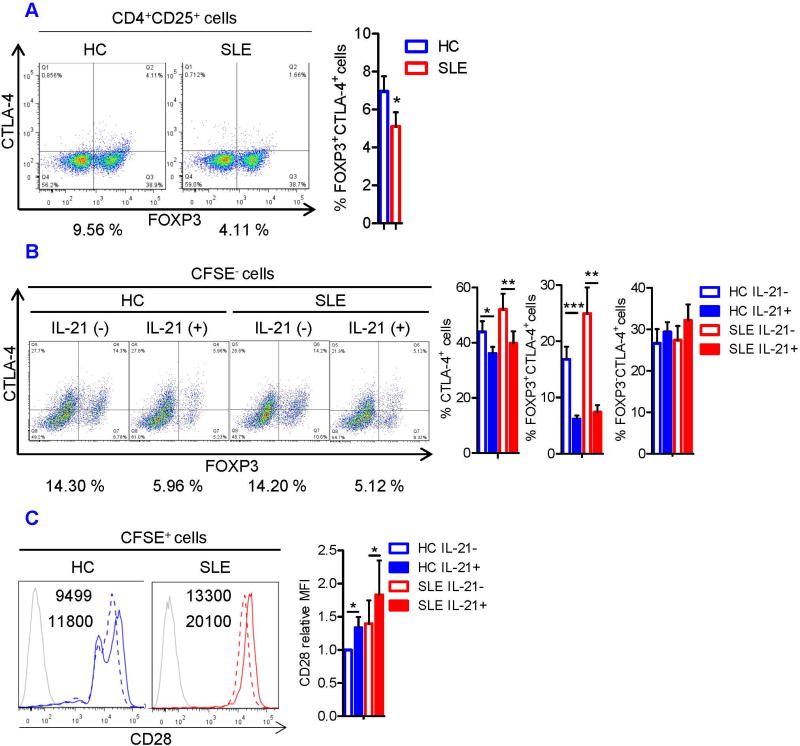
FIGURE 4. IL-21 induces CTLA-4 deficiency in Tregs.
(A) Magnetically isolated HC and SLE CD4+CD25+ cells were examined for FOXP3 and CTLA-4 expression by flow cytometry. Representative flow cytometry dot plots showing FOXP3 versus CTLA-4 expression (left). Numbers below the dot plots represent the frequency of CTLA-4+ cells among CD4+CD25+ FOXP3+cells. Cumulative data showing CTLA-4 expression in CD4+CD25+FOXP3+ Tregs from 8 pairs of matched HC and SLE subjects (right). Data were analyzed by a paired two-tailed t-test (*p<0.05). (B) CFSE-stained CD4+CD25− responder T cells from HC and SLE donors were cultured for 5 days with irradiated PBMCs and CD4+CD25+ Tregs as described in Fig 1. Representative flow cytometry dot plots showing FOXP3 versus CTLA-4 expression in CFSE− cells (left). Numbers below the dot plots represent the frequency of FOXP3+CTLA-4+ cells. Cumulative data showing the frequency of CTLA-4+cells, FOXP3+CTLA-4+ cells, and FOXP3−CTLA-4+ cells among the CFSE− cells from 8 pairs of matched HC and SLE subjects (right). The results were analyzed by a paired two-tailed t-test (*, p<0.05; **, p<0.01; ***, p<0.001). (C) Representative histograms of CD28 expression in IL-21-treated (solid line) and –untreated (dashed line) CFSE+ cells (left). Grey histograms represent unstained samples. Numbers in the histograms denote the MFI of CD28. MFI of CD28 was normalized to that of IL-21-untreated HC cells. Cumulative data from 8 pairs of matched HC and SLE subjects (right). Data were analyzed by a paired t-test (*, p<0.05).

