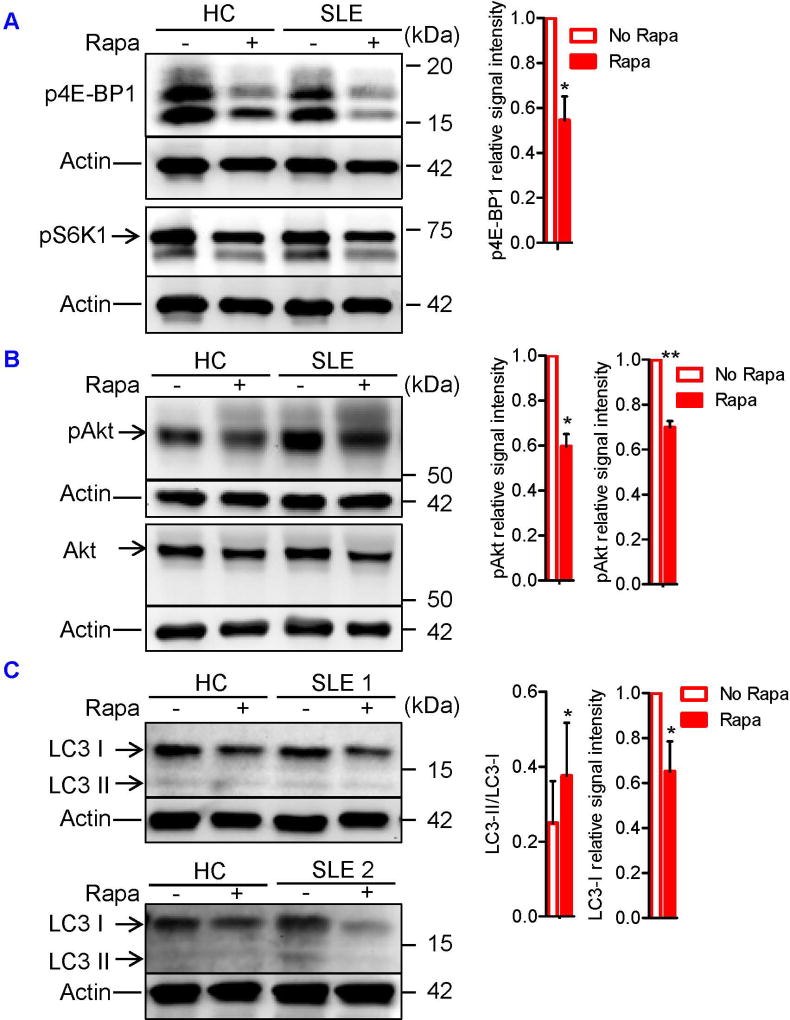
FIGURE 5. Dual blockade of mTORC1 and mTORC2 restores autophagy in SLE Tregs.
CD4+CD25+ Tregs were cultured for 4 weeks in the presence of plate-bound anti-CD3, soluble anti-CD28, and IL-2 (100 IU/ml; omitted in the first week of culture) with or without rapamycin (100 nM). Culture media were changed every week. Expression of Akt, pAktSer473, pS6K1Thr389, p4E-BP1Thr37/46, and LC3 in SLE Tregs were determined by immunoblotting. (A) Representative immunoblot staining of p4E-BP1 and pS6K1 from HC and SLE subjects (left). + and − indicate the presence or absence of rapamycin. The signal intensity of p4E-BP1 was normalized to that of actin, after which relative p4E-BP1 expression to that of rapamycin-untreated sample was determined. Cumulative data from 4 SLE subjects were presented (right). Data were analyzed by a paired two-tailed t-test (*p<0.05). (B) Representative immunoblot staining of Akt and pAkt from HC and SLE subjects (left). + and − indicate the presence or absence of rapamycin. The signal intensity of pAkt was normalized to that of actin, after which relative pAkt expression to that of rapamycin-untreated sample was determined (left in the right panel). The signal intensity of pAkt and Akt were first normalized to that of actin. Relative pAkt expression was normalized to that of Akt (pAkt/Akt expression), after which pAkt/Akt expression to that of rapamycin-untreated sample was determined (right in the right panel). Cumulative data from 3 SLE subjects were presented. Data were analyzed by a paired two-tailed t-test (*, p<0.05; **p<0.01). (C) Representative immunoblot staining of LC3 from HC and two SLE subjects (left). + and − indicate the presence or absence of rapamycin. The signal intensity of LC3-II relative to that of LC3-I was determined. Cumulative data from 4 SLE subjects were presented (left in the right panel). The signal intensity of LC3-I was normalized to that of actin, after which relative LC3-I expression to that of rapamycin-untreated sample was determined. Cumulative data from 1 HC and 4 SLE subjects were presented (right in the right panel). Data were analyzed by a paired t-test (*, p<0.05).

