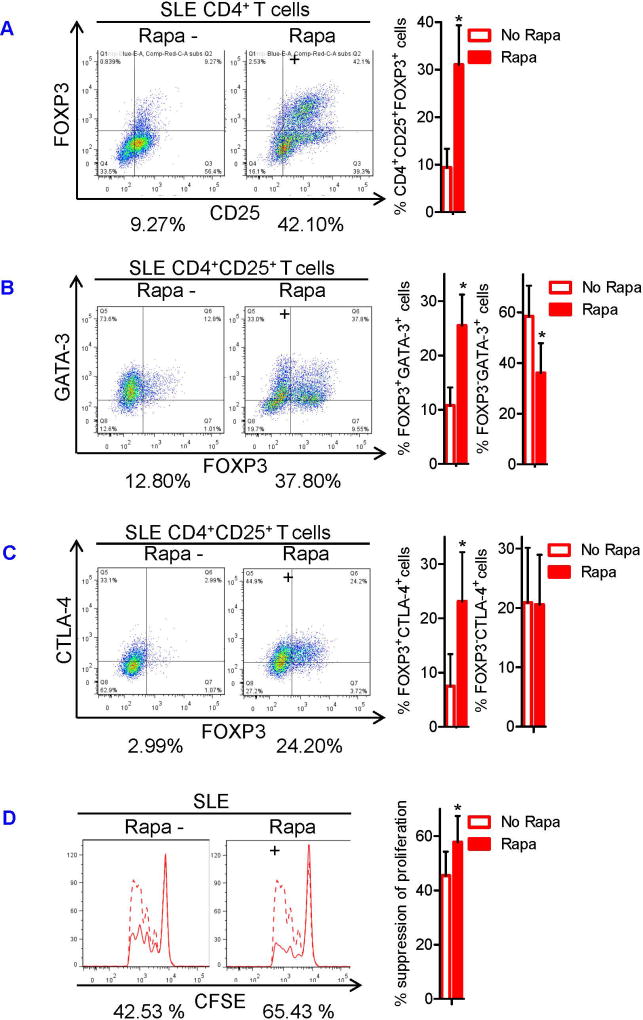
FIGURE 6. mTOR blockade induces expansion and restores GATA-3 and CTLA-4 expression and suppressor function of SLE Tregs.
Sorted CD4+CD25+ T cells were expanded in vitro for 4 weeks in the presence or absence of rapamycin as described in Fig 5. (A) Representative flow cytometry dot plots showing CD25 versus FOXP3 expression in the Tregs (left). Numbers below the dot plots represent the frequency CD4+CD25+FOXP3+ cells. Cumulative data from 4 SLE subjects (right). (B) Representative flow cytometry dot plots showing FOXP3 versus GATA-3 expression among CD4+CD25+ cells (left). Numbers below the dot plots represent the frequency FOXP3+GATA-3+cells among CD4+CD25+ Treg cells. Cumulative data of frequency of FOXP3+GATA-3+cells and FOXP3−GATA-3+cells among CD4+CD25+ Treg cells from 4 SLE subjects (right). (C) Representative flow cytometry dot plots showing FOXP3 versus CTLA-4 expression (left). Numbers below the dot plots represent the frequency of FOXP3+CTLA-4+ cells among CD4+CD25+ Treg cells. Cumulative data of frequency of FOXP3+CTLA-4+ cells and FOXP3−CTLA-4+ cells among CD4+CD25+ Treg cells from 4 SLE subjects (right). (D) Using these Tregs, Treg suppression assay was performed as described in Fig 1. Representative flow cytometry histograms showing CFSE dilution by Tresp cells in the presence (solid line) or absence (dashed line) of Tregs (left). Numbers below the histograms represent % suppression of division index in the presence of Tregs. Cumulative data of Treg suppressor function from 4 SLE subjects (right). The results were analyzed by a paired two-tailed t-test (*, p<0.05).

