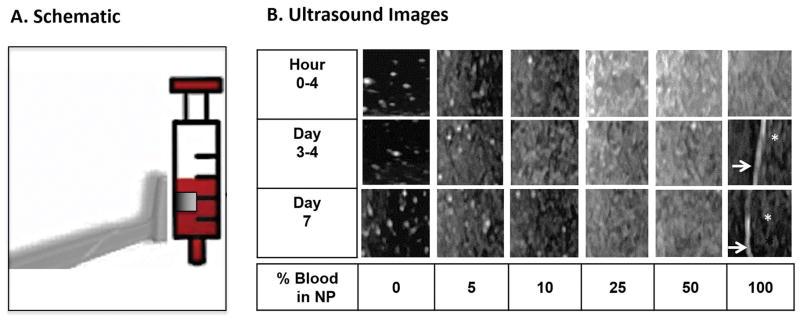
Figure 1. Time course of ultrasound appearance of blood dilutions and clotted blood in vitro.
NP, enriched with 2mg/mL hyaluronic acid, was diluted with increasing concentrations of freshly drawn human blood (3–6cc syringes) and subjected to serial ultrasound imaging at the indicated time points. A. Schematic of the transducer position relative to the syringe. The transducer was aligned in parallel with the syringes in vertical position. The boxed square represents the cropped image used for panel B. B. Ultrasound images. Arrows: Interface between blood clot and serosanguinous fluid. Asterisk: Blood clot abutted by serosanguineous fluid. NP was anechoic, while dilutions with as low as 5% blood generated echogenic signals. Echogenicity increased nonlinearly with increasing blood concentration. Blood clots appeared hypoechoic. As time proceeded, echogenicity of the blood solutions remained relatively unchanged. Hyperechoic speckles visible at 0–10% blood dilutions were generated by non-dissolved hyaluronic acid particles. NP, Normal Pooled Plasma.

