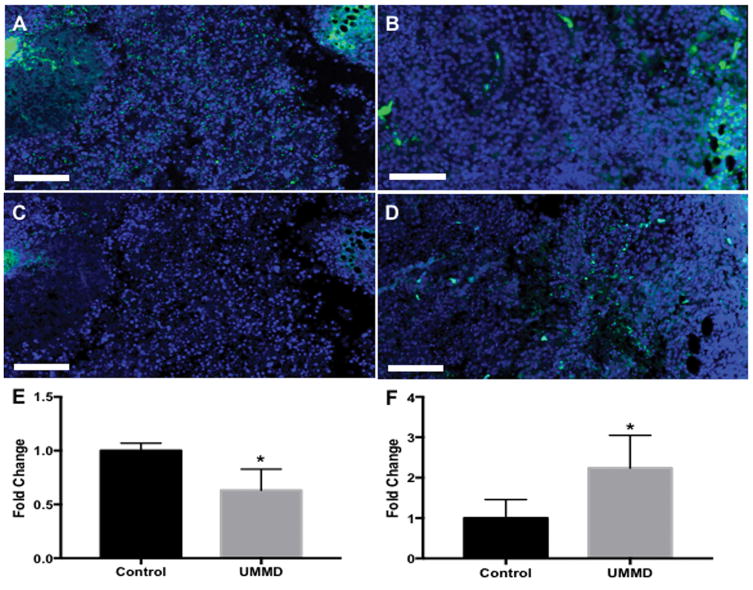
Figure 6.
Fluorescent IHC analysis reveals that UMMD treatment reduces Ki-67 expression and increases MAP2 expression. (A and B) Ki-67 staining shows that UMMD treatment (B) significantly reduced the expression of Ki-67 compared to untreated control (A) and the difference was statistically significant (E). (C and D) The treatment of UMMD significantly enhanced MAP2 expression (D), whereas little was found in the untreated control (C) and the difference was statistically significant (F). Bars = 100 μm. Asterisk (*) represents statistical significance compared with control (*p<0.05 by unpaired T test).

