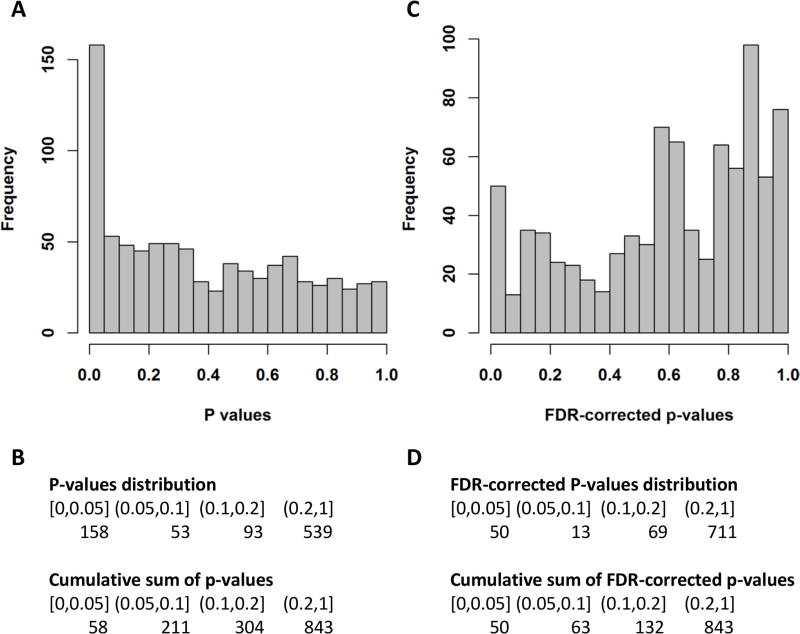
Figure 1.
Results of the linear regression analysis comparing intermediate/high-risk PE to low-risk PE. Each metabolite was regressed on the PE severity subtype (intermediate/high vs. low) adjusting for age, gender and cancer diagnosis. A Histogram of the p-values of the low-risk vs. intermediate/high-risk association analysis for 843 metabolites. B Table view of the distribution of p-values and their cumulative sum. C Histogram of the FDR-corrected p-values of the low-risk vs. intermediate/high-risk association analysis for 843 metabolites. D Table view of the distribution of FDR-corrected p-values and their cumulative sum.

