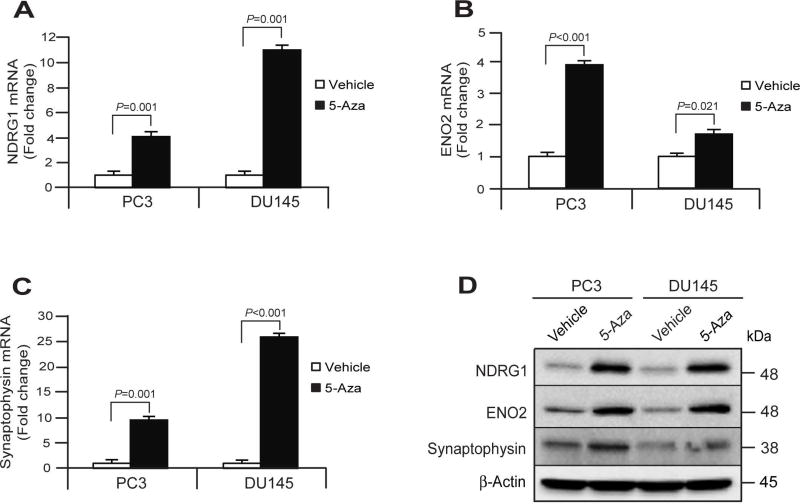
Fig. 2. Increase of expression of neuroendocrine phenotypic marker by epidrug (5-Aza) in PCa cells.
PCa cells (PC3 or DU145) (2 × 10⁵) were seeded in 10cm culture dishes. The cells were treated by vehicle or 5-Aza (5µM) for 10 days. (A–C) mRNA levels of N-Myc downstream regulated 1 (NDRG1), Enolase-2 (ENO2), and Synaptophysin expression in vehicle or 5-Aza (5µM) treated PCa cells (PC3 or DU145) as quantified by real-time PCR. The data in Fig. 2A–C are representative of mean ± s.d (n=6). P values were calculated by Student’s t-test. (D) Protein levels of NDRG1, ENO2, and Synaptophysin following vehicle or 5-Aza (5µM) treatments in PCa cells (PC3 or DU145) as quantified by Western blots.

