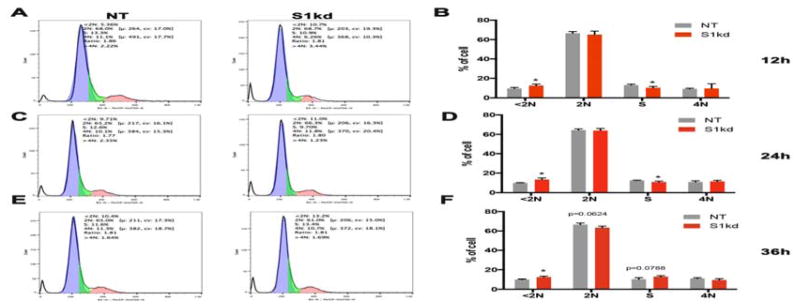
Figure 1. Knockdown of Spry1 attenuates entry into S-phase of hAoSMC in response to growth medium stimulation.
Time course analysis of cell cycle progression using propidium iodide staining followed by flow cytometry. A) Representative cell cycle distribution histograms show a decrease in the fraction of S1kd hAoSMC in S-phase, and an increase of debris in these cells compared to NT control hAoSMC at 12 hours post-stimulation. B) Quantification of all phases of the cell cycle from triplicate experiments at 12 hours post-stimulation. C) Representative cell cycle distribution histograms shown for S1kd hAoSMC compared to NT control at 24 hours post-stimulation. D) Quantification of all phases of cell cycle from a triplicate experiments at 24 hours post-stimulation. E) Representative cell cycle distribution histograms of S1kd hAoSMC compared to NT control at 36 hours post-stimulation. F) Quantification of all phases of cell cycle from a triplicate experiments at 36 h post-stimulation.

