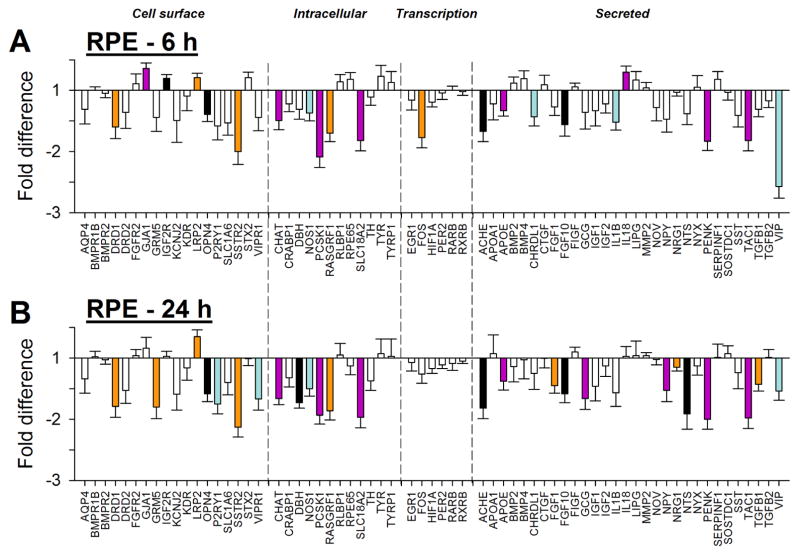
Figure 4.
RPE gene expression fold-differences (treated vs. control eyes) in the (A) 6h and (B) 24h groups. Negative values represent down-regulation in the treated eyes. Headings separated by vertical dashed lines indicate cellular location/functional category of the gene’s protein product. Filled bars represent statistically significant differences (p<0.05); bar color is arbitrary and intended to help in comparing the same gene in the different conditions; error bars = SEM.

