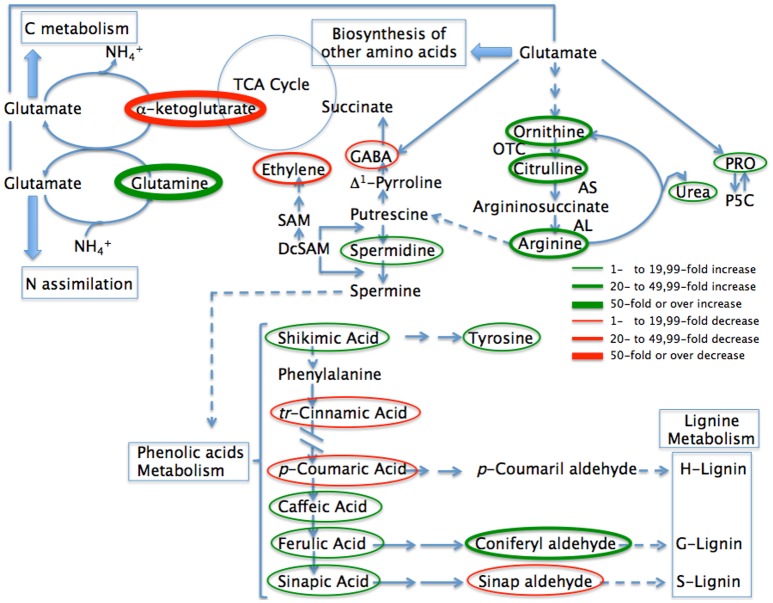
Figure 5.
Abbreviated pathway for the biosynthesis of metabolites most affected in pepper plants when inoculated with Microbacterium sp. 3J1 during drought compared with uninoculated plants. Metabolites where the concentration is reduced as the result of microbial inoculation are circled in red while those where the concentration increases are circled in green. Thin circles represent changes between 1 and 19.99-fold, medium size circles represent changes from 20- to 49.99-fold in concentration, while thicker circles represent changes over 50-fold in concentration. The most likely pathways are represented. TCA, Tricaboxylic acid; PRO, proline; P5C, proline 5 carboxylate; OTC, ornithine transcarbamoylase; AS, argininosuccinate synthase; AL, argininosuccinate lyase; SAM, S-adenosylmethionine; DcSAM, decarboxilated S-adenosylmethionine.

