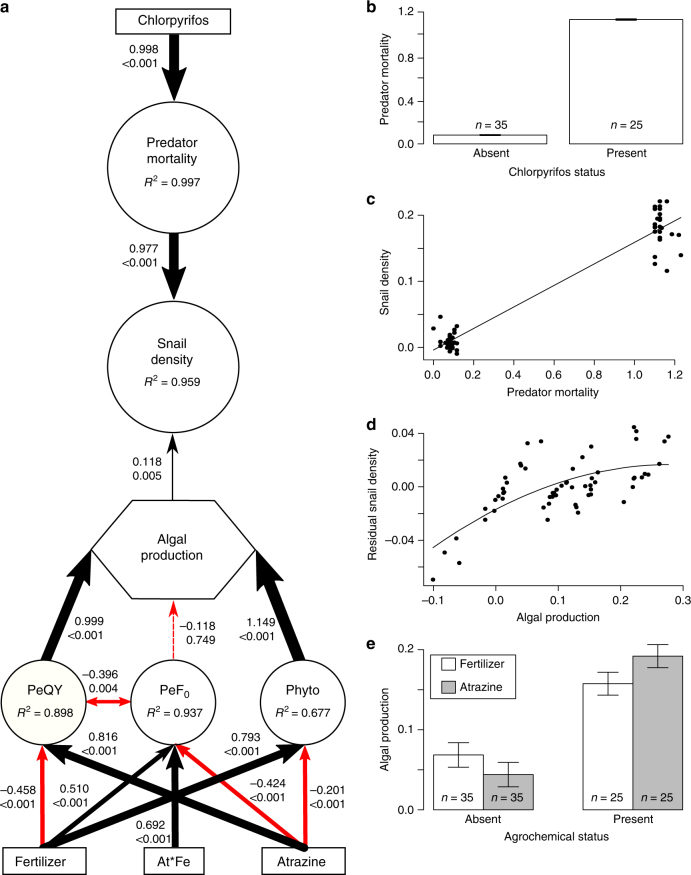
Fig. 1.
Top-down and bottom-up effects of agrochemicals on snail densities. Combined factor and path analysis (a), demonstrating top-down effects of chlorpyrifos increasing predator mortality (b) and snail density (c) and bottom-up effects of atrazine and fertilizer increasing snail density (d) through increased algal productivity (e). Size of arrows in a are scaled to the standardized coefficient (top number next to each arrow), with black and red arrows indicating positive and negative coefficients, respectively. Double-ended arrows exhibit significant covariation accounted for in the structural equation model. P-values for paths in the model are reported below each standardized coefficient. Boxes represent exogenous predictor variables, circles represent latent variables, and algal production was measured as a composite variable (hexagon). Indicator variables for latent and composite variables have been omitted from the figure to reduce visual complexity, but are reported in Supplementary Table 1. Importantly, the latent variable snail density represents the densities of all three snail species at multiple life stages (egg, hatchling, and adult), all of which exhibited similar responses across treatments. e represents the net main effects of fertilizer and atrazine presence on composite algal productivity. Axes on panels b–e are derived from latent variable scores for each replicate and thus have no units of measurement; however, raw data are available in the supplemental materials. PeQY = periphyton photosynthetic efficiency; PeF0 = periphyton chlorophyll a; Phyto = phytoplankton chlorophyll a and photosynthetic efficiency; At*Fe = atrazine x fertilizer interaction term

