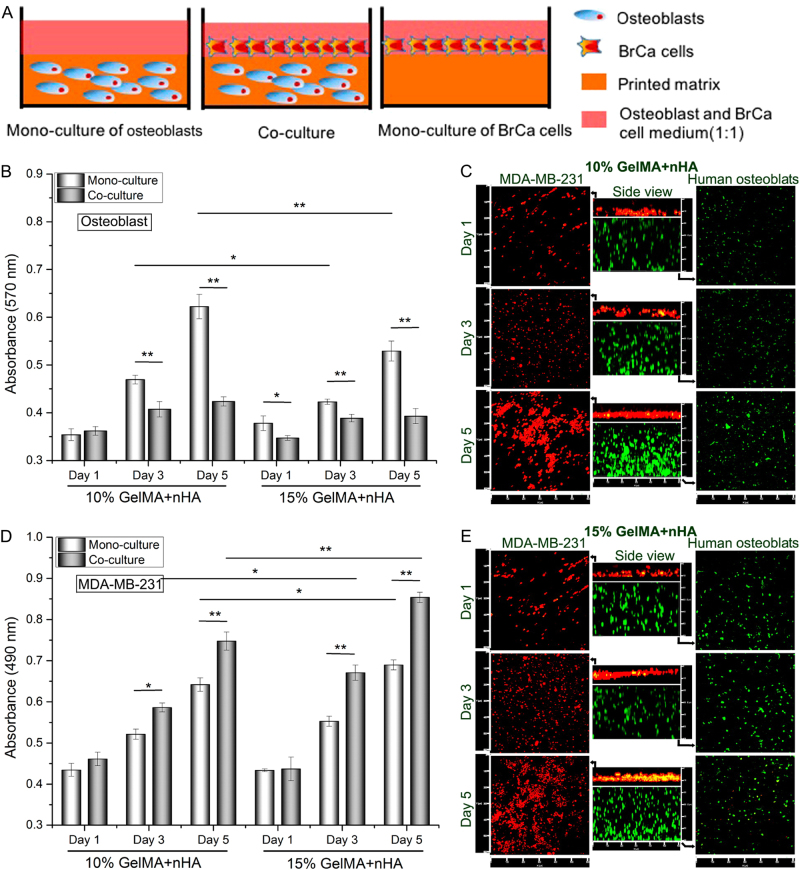
Fig. 5.
a Schematic diagram of osteoblasts and BrCa cells mono- and co-cultured in the 3D bioprinted matrix. Proliferation of b osteoblasts and d BrCa cells mono- and co-cultured in the 3D bioprinted matrix after 1, 3 and 5 days. *P < 0.05, **P < 0.01. c, e Confocal micrographs of osteoblasts and BrCa cells co-cultured in the 3D bioprinted matrix after 1, 3 and 5 days. The middle columns in c, e represent the cross-sectional views. Osteoblasts and BrCa cells were stained by Cell Tracker Green CMFDA dye (green) and Orange CMTMR dye (red), respectively. Reprinted with permission from ref.129 Copyright (2016) American Chemical Socie1ty

