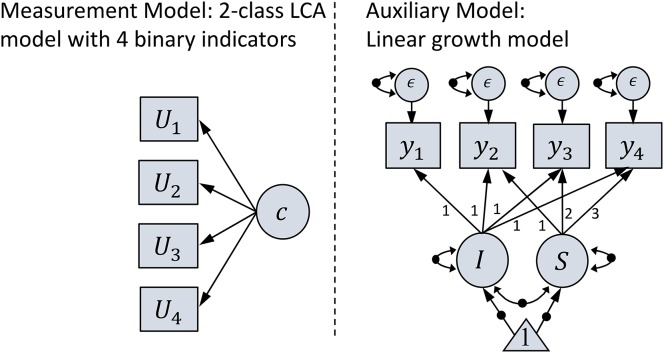
Figure 1.
Graphical representation of the studied two-phase mixture model. On the measurement model, U1, U2, U3, and U4 represent four dichotomous outcome variables related to latent class variable c. On the auxiliary model, y1, y2, y3, and y4 represent repeatedly measured outcome variable at four time points. Also, I represents the growth intercept, S represents the growth slope, and ϵ represent the residuals. Black dots indicate that parameters represented by these arrows are different between latent classes.

