
FIGURE 2.
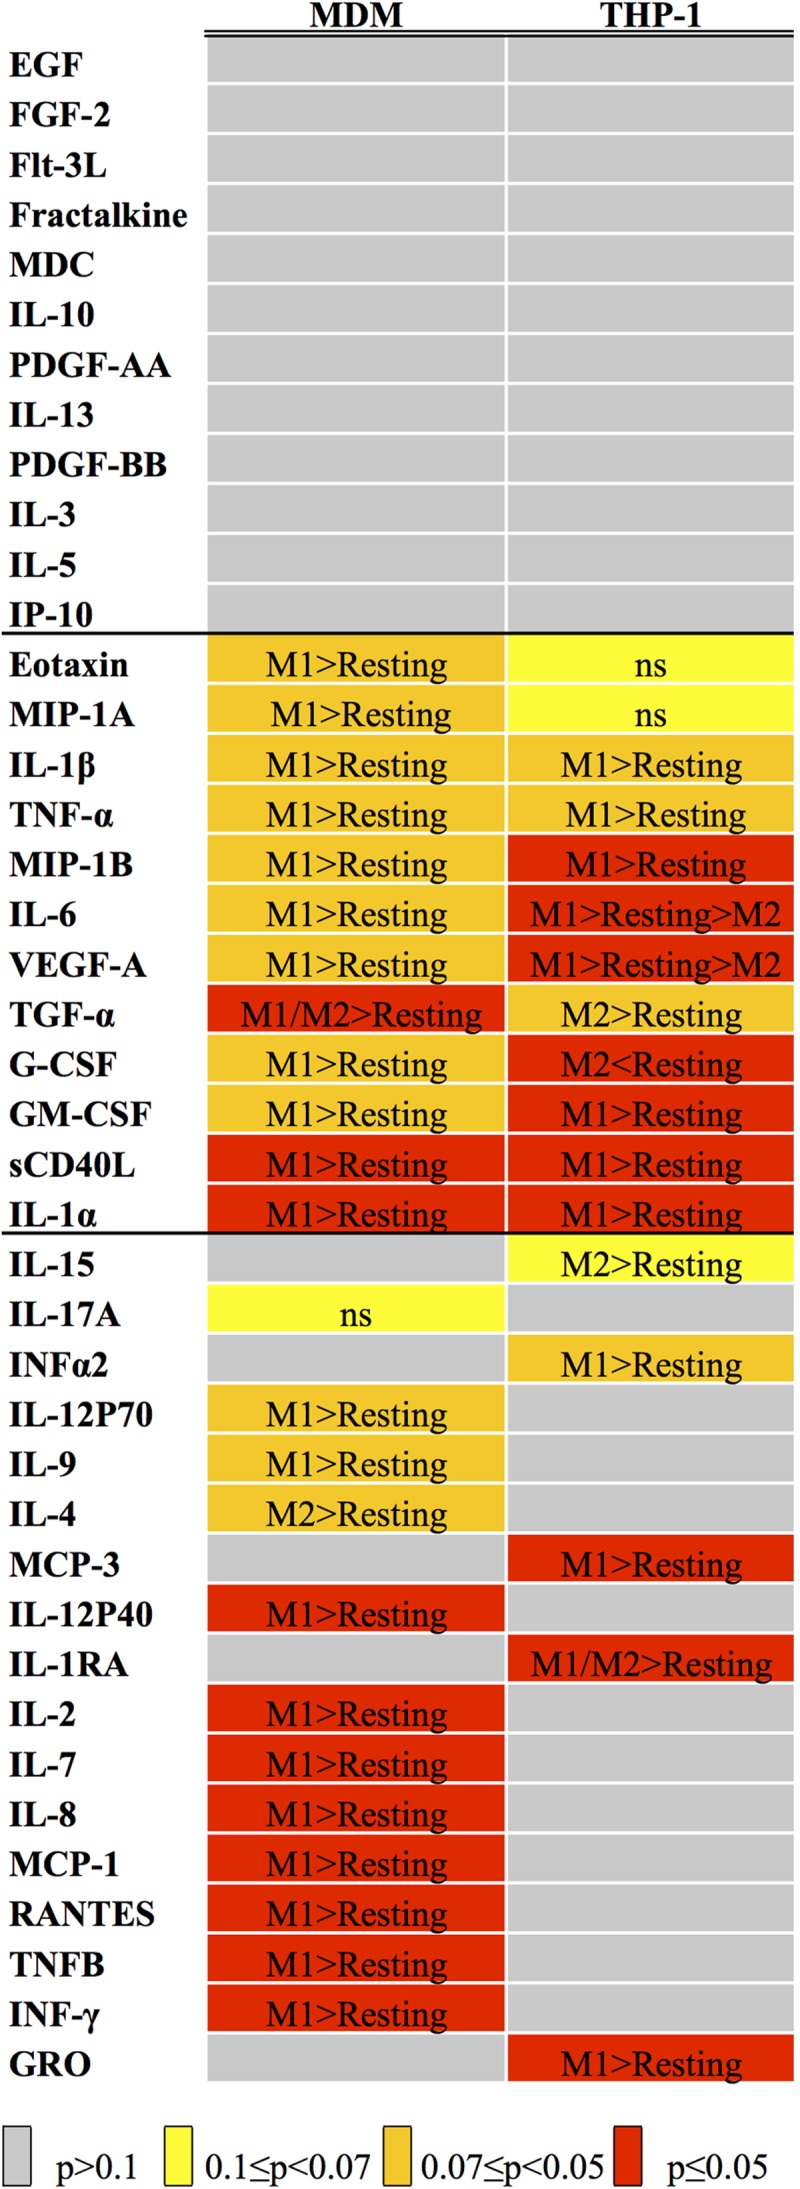
Statistical analysis of Luminex data. The heat map indicates the results of the variance analysis performed with the Kruskal–Wallis test considering the three experimental conditions (Resting, M1 and M2), expressed as p-values. The color code is listed below the map. When p was ≤0.1, we carried out a post hoc analysis with the Mann–Whitney test, comparing M1 versus Resting and M2 versus Resting. The results of such analyses are reported inside each cell (see Supplementary Table 1 for p-values).