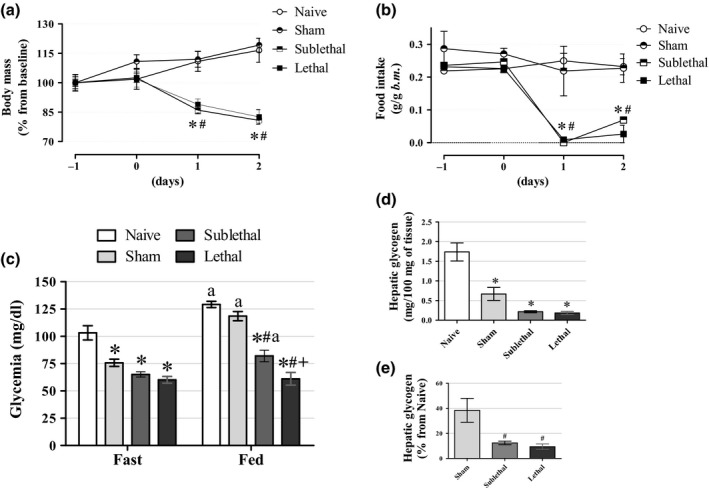
Figure 2.

Body mass, food intake and blood glucose levels (a) The average body mass values during the progression of sepsis induced by CLP. We can note the significant reduction in body mass in the CLP groups after 24 and 48 h of surgery (n = 5 for Naive, 5 for Sham, 9 for Sublethal and 9 for Lethal groups). (b) The average food intake values during the progression of sepsis induced by CLP. We can observe the significant reduction in food intake after 24 and 48 h of surgery in the CLP groups (n = 5 for Naive, 5 for Sham, 9 for Sublethal and 9 for Lethal groups). (c) Fasting and fed blood glucose values 24 h after CLP. Fasting blood glucose values were significantly decreased in Sham and CLP mice, which remained reduced only in the CLP mice in their fed state (n = 12 for Naive, 12 for Sham, 8–11 for Sublethal and 9–11 for Lethal groups). (d, e) Hepatic glycogen content 24 h after CLP in 12‐h fasted mice. We can observe the pronounced reduction in hepatic glycogen content in both CLP groups (n = 8 for Naive, 8 for Sham, 9 for Sublethal and 7 for Lethal groups). Results are expressed as mean ± SEM. *significantly different vs. Naive group, #significantly different vs. Sham group and +significantly different vs. Sublethal group using anova with Tukey's post hoc test. P < 0.05.
