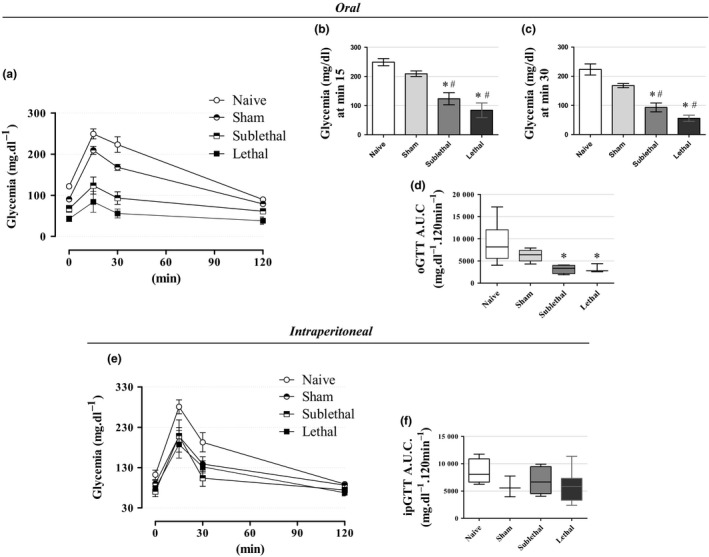
Figure 4.

Glucose tolerance (a‐c) The average blood glucose values during an oral glucose tolerance test (oGTT) and (d) the respective area under curve (A.U.C.) for blood glucose values in fasted mice. The oGTT values revealed an increase in glucose tolerance in the CLP groups 24 h after surgery (n = 14 for Naive, 10 for Sham, 6 for Sublethal and 6 for Lethal groups). (e) The average blood glucose values during an intraperitoneal glucose tolerance test (ipGTT) and (f) the respective A.U.C. for blood glucose values. The ipGTT values revealed no alterations in glucose tolerance in the CLP groups 24 h after surgery (n = 5 for Naive, 5 for Sham, 7 for Sublethal and 8 for Lethal groups). Results are expressed as mean ± SEM in ‘a, b, c, e’ graphs, and as median and interquartiles in ‘d, f’ graphs. *significantly different vs. Naive group and #significantly different vs. Sham group using anova with Tukey's post hoc test for ‘a, b, c, e’ data or Kruskal–Wallis with Dunn's post hoc test for ‘d, f’ data. P < 0.05.
