Figure 5.

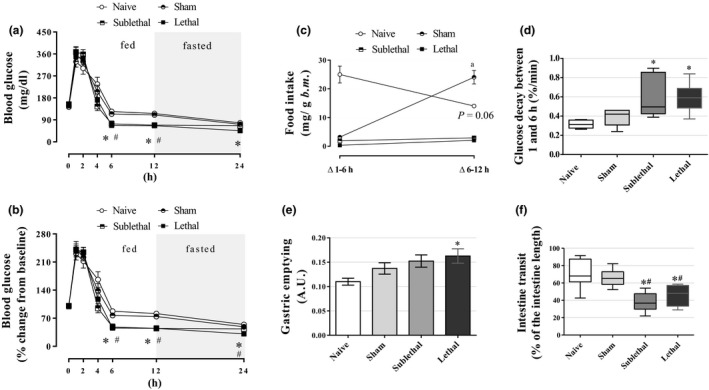
Time course of blood glucose and gastrointestinal motility (a, b) The average blood glucose values during the course of 24 h after CLP procedure (n = 5 for Naive, 7 for Sham, 11 for Sublethal and 16 for Lethal groups). (c) Food intake during the course of 12 h after the CLP procedure (n = 5 for Naive, 7 for Sham, 11 for Sublethal and 16 for Lethal groups). (d) Glucose decay between 1 and 6 h after the CLP procedure (n = 5 for Naive, 7 for Sham, 11 for Sublethal and 16 for Lethal groups). (e) The gastric emptying determined as the remained dye in the stomach [higher the arbitrary unit (A.U.), lower was the gastric emptying] (n = 6 for Naive, 6 for Sham, 8 for Sublethal and 8 for Lethal groups). (f) The intestinal transit measured by the percentage of the intestine length (n = 8 for all groups). Results are expressed as mean ± SEM in ‘a, b, c, e’ graphs, and as median and interquartiles in ‘d, f’ graphs. *significantly different vs. Naive group and #significantly different vs. Sham group using anova with Tukey's post hoc test for ‘a, b, e’ data or Kruskal–Wallis with Dunn's post hoc test for ‘d, f’ data. Wilcoxon paired test was applied to ‘c’ data where the letter ‘a’ and p‐value means difference from Δ1‐6 h. P < 0.05. In ‘b’ graph, only the Lethal group was different from the Naive and Sham groups at 24 h.
