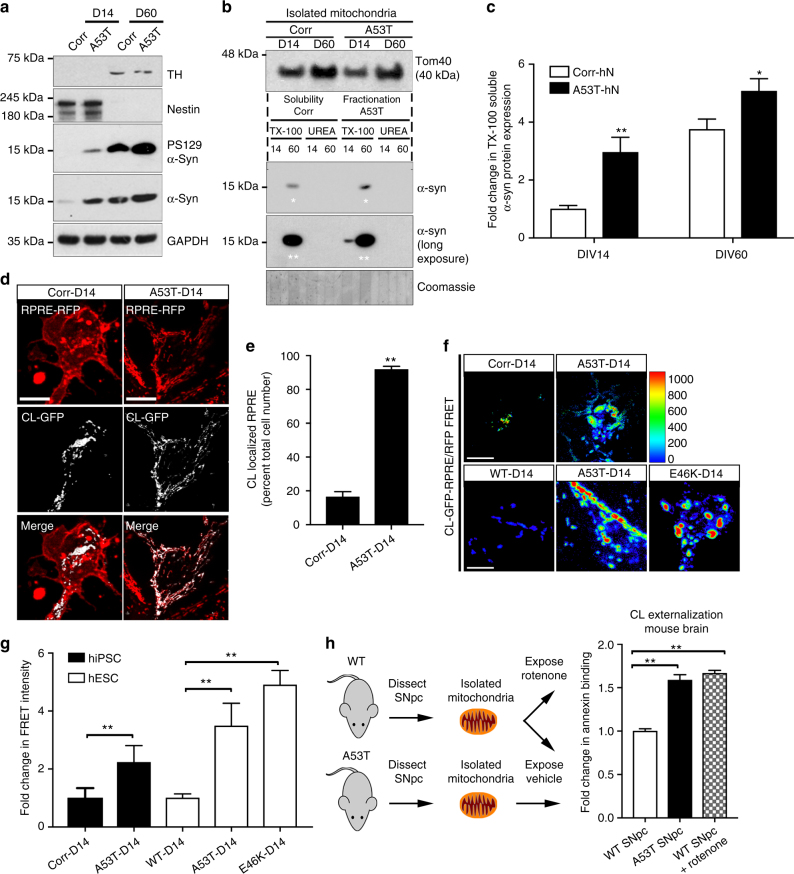
Fig. 4.
Cardiolipin is externalized to the mitochondrial surface in α-syn mutant hNs and transgenic mice in response to α-syn accumulation. a Western analysis of lysates from corrected and A53T cells at DIV 14 and DIV 60 labeled for total α-syn, PS129, TH (DA neuronal marker), nestin (NPC marker) or GAPDH show that levels of PS129-modified α-syn are elevated in A53T hNs at DIV 14 and remain elevated at DIV 60 relative to corrected cells. b, c Mitochondria were purified from A53T cells and genetically corrected cells at both DIV 14 and DIV 60. Lysates were then separated based on TX-100 solubility (soluble) or urea solubility (insoluble). Western analysis of A53T cells shows elevated soluble α-syn at the mitochondria relative to corrected cells at DIV 14 and DIV 60 (denoted by ** and * respectively). Quantification of soluble and insoluble α-syn levels in mitochondrial fractions normalized to Coomassie (c). Data represent mean ± s.e.m. *P < 0.05, **P < 0.01 by ANOVA followed by Tukey’s post hoc test, n = 4. d, e Micrographs of corrected and A53T-mutant NPCs expressing the negative charge probe RPRE-RFP and CL-GFP show RPRE-RFP translocation from a primarily plasma membrane localization in isogenic-corrected hNs to a punctate intracellular localization in A53T hNs in tight cellular localization with CL-GFP (d). Quantification of percent total cell number with colocalized RPRE-RFP and CL-GFP (e). Data represent mean ± s.e.m. **P < 0.0001 by t-test, n = 3 coverslips over 2 independent differentiations, DIV: 14; scale bar: 10 μm. f, g Fluorescence resonance energy transfer (FRET) from CL-GFP to RPRE-RFP in hiPSC-derived A53T and corrected hNs or hESC-derived WT, A53T and E46K hNs was assessed (f) and mean FRET intensity was quantified (g). Data represent mean ± s.e.m. **P < 0.01 by ANOVA followed by Tukey’s post hoc test, for hiPSCs, n = 6, for hESCs, n = 8 coverslips over two independent differentiations, DIV: 14. Scale bar: 10 µm. h Mitochondria were isolated from the SNpc of 6-month-old WT and A53T transgenic animals and labeled with Annexin V to measure the abundance of cardiolipin on the mitochondrial surface. Controls were rotenone-exposed WT samples. Animals were not randomized, nor was the analysis blinded. Data represent mean ± s.e.m. **P < 0.01 by ANOVA followed by Dunnett post hoc test, n = 4. Clipart was obtained at clker.com

