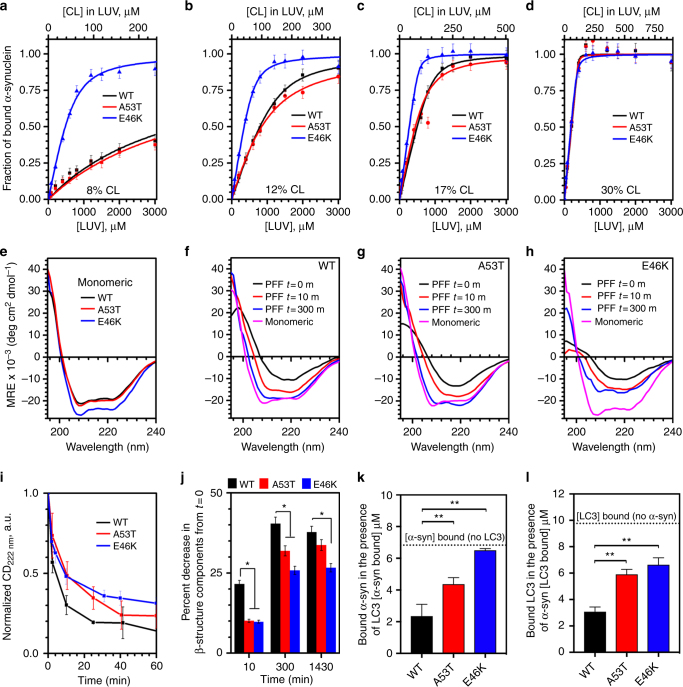
Fig. 5.
Cardiolipin promotes refolding of α-syn fibrils. a–d Binding of WT, A53T or E46K α-syn monomers to OMM-like LUVs, with increasing molar ratios of CL, was measured by CD spectroscopy and the 222 nm signal was used to calculate the fraction of bound α-syn. Data are plotted as change in fraction of bound protein vs. the total concentration of LUVs (bottom axis) or the total concentration of cardiolipin in the LUV (top axis). Binding parameters were calculated by fitting the data to Eq. 1 (Methods) and are reported in Supplementary Table 1. e Representative CD spectra of the monomeric WT, A53T or E46K α-syn in the presence of 1.2 mM LUVs containing 30% CL. f–h Refolding of WT (f), A53T (g) or E46K (h) α-syn preformed fibrils in the presence of 1.2 mM LUVs containing 30% CL was monitored at multiple time points by CD spectroscopy to follow the redistribution of the secondary structural components (from primarily β-structures to primarily α-helical structures). The magenta line shows the CD spectra of the monomeric WT, A53T or E46K α-syn in the presence of 1.2 mM LUVs as a reference standard. i Change in CD signal at 222 nm collected as a function of time. Kinetic data were fitted by exponential decay and the calculated rates of refolding were 3.79 ± 0.46 h−1 vs. 2.44 ± 0.42 h−1 vs. 1.30 ± 0.49 h−1 for WT, A53T and E46K α-syn, respectively (P < 0.05). j Relative decrease in the β-structure components determined by deconvolution of CD spectra presented in f–h. Data represent mean ± s.e.m. *P < 0.05 by ANOVA, followed by Dunnett post hoc test, n = 3. k, l WT, A53T or E46K α-syn (10 μM) was incubated with 0.5 mM LUVs containing 30% cardiolipin in the presence or absence of equimolar LC3 protein and concentration of α-syn bound to LUVs (k) or LC3 bound to LUVs (l) was determined by flotation assay. Pleated line indicates the amount of LUV bound α-syn in the absence of LC3 (k) or the amount of LC3 bound in the absence of α-syn (l). Data represent mean ± s.e.m. **P < 0.01 by ANOVA, followed by Dunnett post hoc test, n = 3

