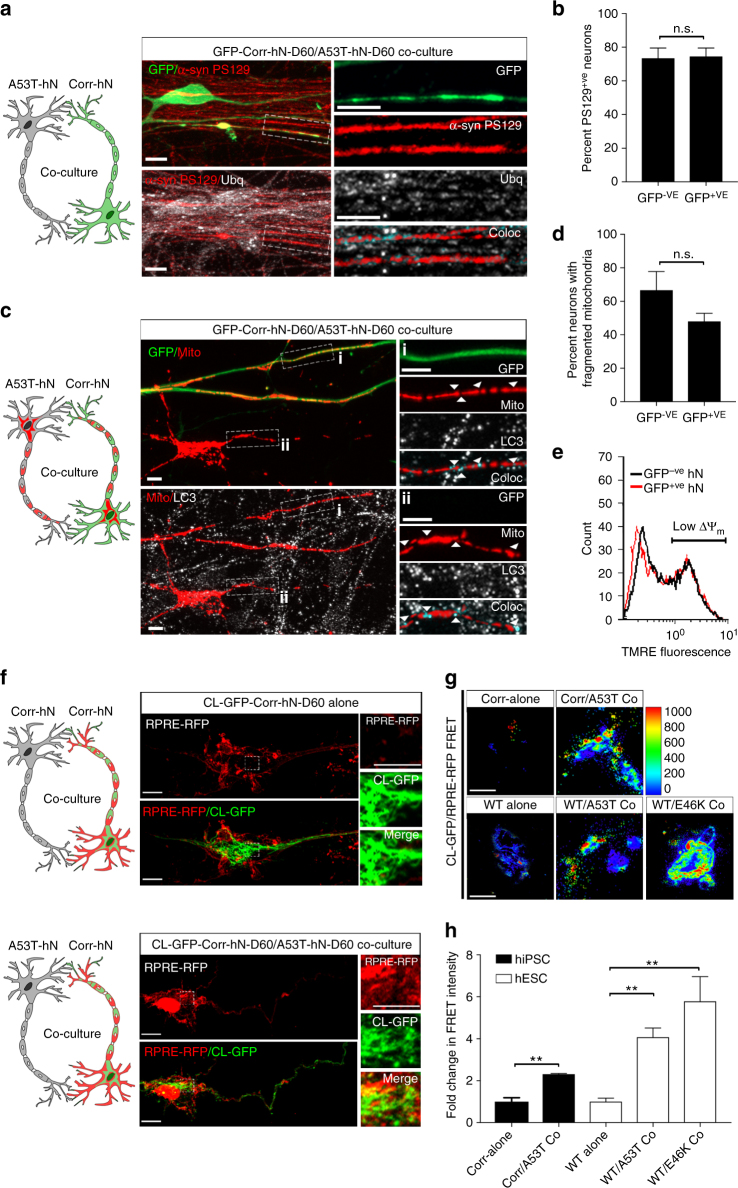
Fig. 6.
A53T hNs transmit mitochondrial pathology to corrected hNs. a, b Micrographs of co-cultured GFP+ve-corrected and GFP−ve-A53T-mutant hNs antigenically labeled for ubiquitin (Ubq) and PS129; scale bar: 10 μm (a). Enlarged regions of GFP+ve neurites and GFP−ve neurites show that both display equal Ubq/PS129 colocalization. Boolean operation was employed to label regions of colocalization in blue, scale bar: 50 μm. Quantifications of PS129+ve neurons within the GFP+ve and GFP−ve populations (b). Data represent mean ± s.e.m. P = 0.8919 by t-test, 10 coverslips over 3 independent differentiations, DIV: 60. c, d Micrographs of GFP+ve-corrected and GFP−ve-A53T-mutant hNs expressing mitoDSRed and antigenically labeled for endogenous LC3. GFP+ve neurites (i) and GFP−ve neurites (ii) are enlarged and show LC3 punctate colocalizes with mitochondria. Arrows show areas where LC3 colocalizes with MitoDSRed. Boolean operation was employed to label regions of colocalization in blue, scale bar: 10 μm. d Quantification of percentage of total GFP+ve and GFP−ve hNs that have fragmented mitochondria. Data represent mean ± s.e.m. P = 0.1479 by t-test, n = 8 coverslips over 3 independent differentiations, DIV: 60. e Co-cultures were labeled with 200 nM TMRE, and mitochondrial potential (ΔΨm) was measured by flow cytometry using the dequench method in GFP+ve (red trace) and GFP−ve (black trace) populations. Representative plot illustrating that GFP+ve corrected cells within co-cultures have adopted a pattern indicative of mitochondrial depolarization. Representative trace from 3 independent experiments (10,000 events per experiment), DIV: 60. f Corrected cells expressing CL-GFP and RPRE-RFP were differentiated in co-cultured with either RFP-ve/GFP−ve Corrected or RFP-ve/GFP−ve A53T hNs. Translocation of cardiolipin from the IMM to the OMM was assessed by visualizing the redistribution of RPRE-RFP from the plasma membrane to the cardiolipin-GFP+ve mitochondria. Magnified insets show CL-GFP colocalization with RPRE-RFP in Corrected hNs when differentiated in co-culture, scale bar: 10 μm. g, h Fluorescence resonance energy transfer (FRET) from CL-GFP to RPRE-RFP in hiPSC-derived A53T and corrected hNs or hESC-derived WT, A53T and E46K hNs was assessed (g) and mean FRET intensity was quantified (h). Data represent mean ± s.e.m. **P < 0.01 by Student's t-test, n = 5 coverslips over two independent differentiations, DIV: 60. Scale bar: 10 µm. Clipart was obtained at clker.com

