
Fig. 7.
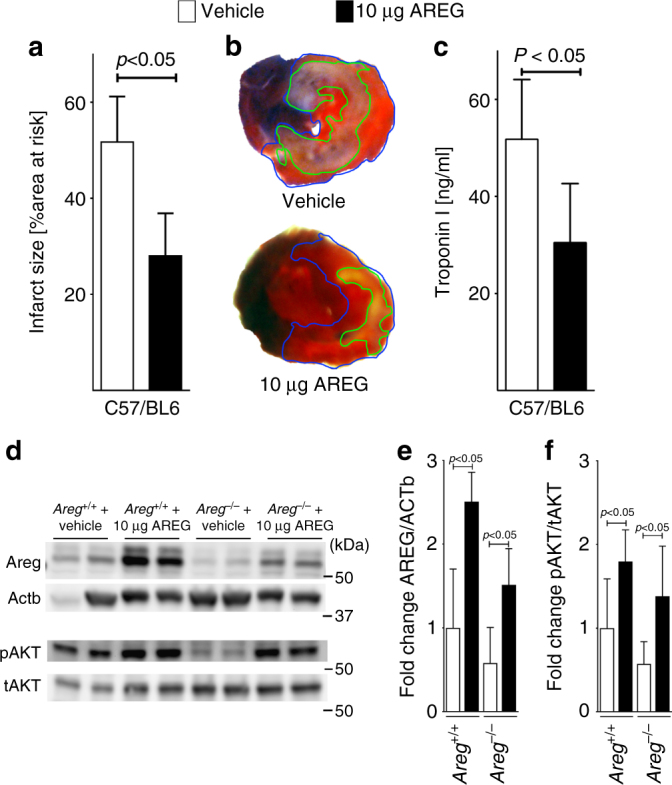
Treatment of murine myocardial ischemia and reperfusion injury with recombinant amphiregulin. a–c Wild-type were exposed to 60 min of myocardial ischemia, followed by 120 min of reperfusion; infarct sizes were measured by double staining with Evan’s blue and triphenyltetrazolium chloride and serum samples were collected. All Infarct sizes are presented as the percentage of infarcted tissue in relation to the area-at-risk. Serum troponin levels were determined by ELISA. a Infarct sizes of C57/BL6 mice after 60 min of ischemia and 120 min reperfusion, treated with vehicle or 10 µg recombinant murine AREG, administered over a 15 min period via an indwelling arterial catheter. Data presented are the percentage of infarcted area in relation to area-at-risk. Statistical significance assessed by two-sided, unpaired Student’s t-test (n = 7 per group; data presented as mean ± SD). b Representative infarct staining of C57/BL6 treated with vehicle or 10 µg recombinant murine AREG. c Serum troponin levels of C57/BL6 mice, after 60 min ischemia, 120 min reperfusion, treated with vehicle or 10 µg recombinant murine Areg. Statistical significance assessed by two-sided, unpaired Student’s t-test (n = 5 per group; data presented as mean ± SD). d Areg+/+ or Areg−/− mice received treatment with vehicle or 10 μg of recombinant murine AREG, administered over a 15 min period by an indwelling catheter. The animals underwent 60 min ischemia and 120 min reperfusion, followed by total protein isolation form the area-at-risk. Upper panel: protein was immunoblotted for AREG, β-actin (ACTb) served as a loading control. Lower panel: protein was immunoblotted for total AKT (tAKT) and phosphorylated AKT (pAKT), respectively. Two samples for each condition and genotype are presented. One representative blot out of three experiments is shown. e, f Quantification by densitometry of the AREG and pAKT immunoblot results relative to ACTb or Total AKT (tAKT). Data are expressed as mean fold change ± SD normalized to vehicle treated Areg+/+ and compared by one-way ANOVA followed by Bonferroni’s multiple comparison test (Areg+/++Vehicle n = 5; all other groups n = 6 mice per group, e F3,19 = 23,11, p < 0.0001; f F3,20 = 9,549, p = 0.0002)