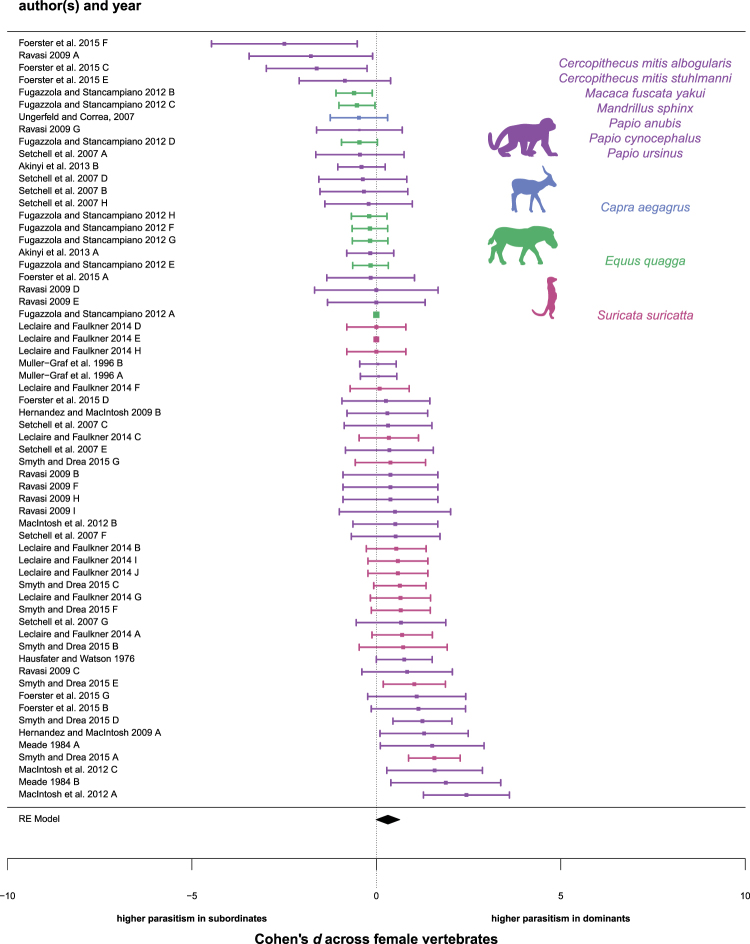
Figure 2.
A forest plot showing the effect sizes of all female studies that tested the association between social status and parasitism. Positive values indicate higher parasitism in dominants; negative values indicate higher parasitism in subordinates. The error bars represent the 95% CI lower limit and the 95% CI upper limit; the square represents the effect size (d) of each study. The center of the diamond represents the effect size and its length represents the 95% CI for all female studies. Purple = Order PrimatesA; Blue = Order PerissodactylaB; Green = Order ArtiodactylaC; Pink = Order CarnivoraD. Silhouettes are adapted from “Monkey”A, “Impala”B, “Zebra”C, and “Meerkat”D icons by Anniken & Andreas from the Noun Project.

