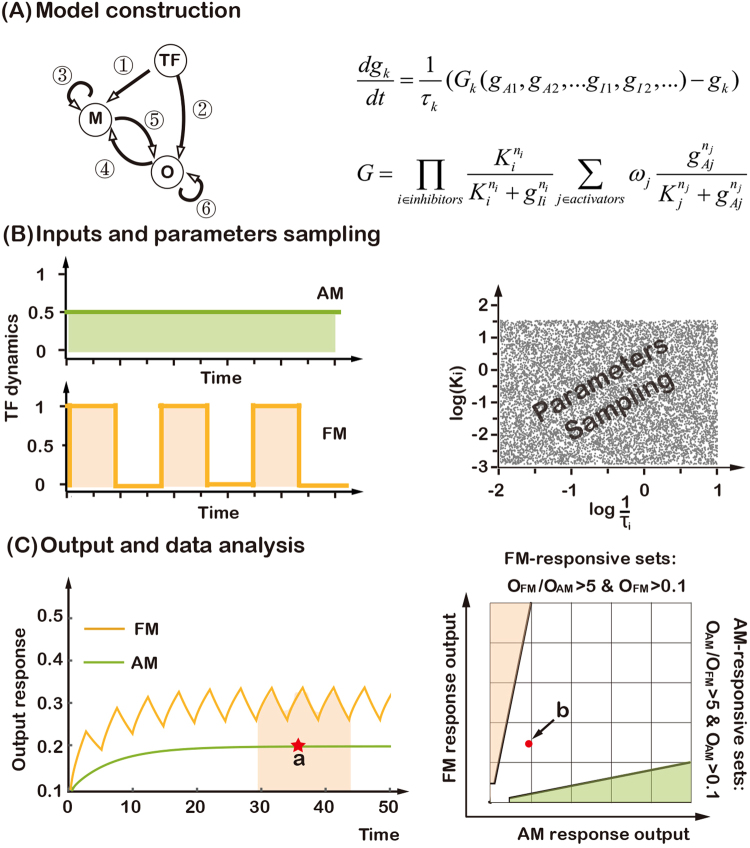
Figure 2.
Searching for topologies that can differentially decode different transcription factor dynamics. (A) Possible direct links among three nodes (left) and the mathematical model (right). Each link can be in one of the three states: activation, inhibition, or no regulation. (B) AM and FM input dynamics of transcription factor (left) and Latin Hypercube sampling of the parameters of the model (right). (C) For AM, the steady-state output (a) is recorded. For FM, the asymptotic average output (schematically shown within the colored area) is recorded in the simulations (left). Illustration of the output analysis and the criterion for decoding AM- and FM-inputs (right), Red dot (b) represents the output from the example of the left panel.

