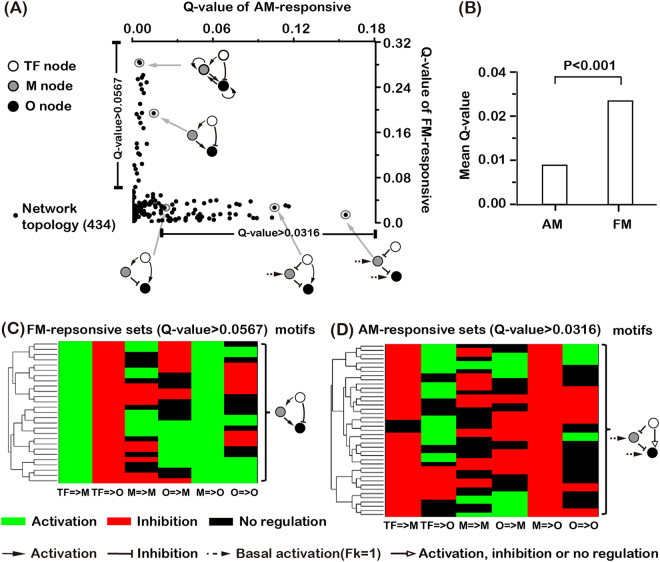
Figure 3.
Network’s ability and typical motifs to decode AM and FM inputs. (A) Scatter plot for the Q values of AM- and FM-responsive sets. Each point represents one of the 434 networks. Also shown are representative motifs in decoding FM and AM inputs. (B) The mean Q value of AM- and FM-responsive sets for the 434 networks. Student’s t-test was used to obtain the significance. (C) Clustering of networks with FM Q value >0.0567 (20% of the maximum FM Q value). Common structural features are extracted and shown on the right of the panel. (D) Same as in (C), for networks with AM Q value >0.0316 (20% of the maximum AM Q value).

