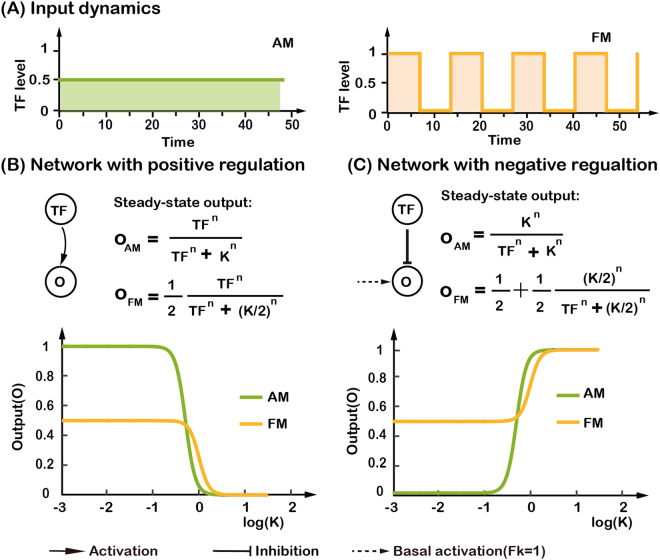
Figure 4.
Analysis of two-node networks for decoding AM and FM input signals. (A) Input signals with two different transcription factor dynamics, whose strengths has equal total area under the input curves. (B) Steady-state expression level of the target gene for two-node network with positive regulation. It is plotted as a function of log(K) with n = 4 for FM input (yellow) and AM input (green), respectively. (C) Same as in (B), but with negative regulation.

