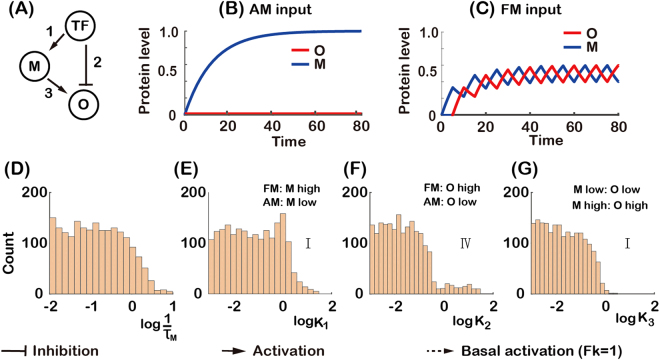
Figure 6.
Analysis of FM-responsive topology. (A) A FM-responsive network with numbered links. (D–G) The histograms of functional parameters. (D) Parameter τM is the half-life of the gene product of node M. (E–G) Parameter Ki is the activation or repression threshold of the ith link. Roman numerals indicate the parameter regions of two-node networks in Fig. 5A and B. The distributions of the other functional parameters do not differ significantly from the uniform distribution and are not shown. The combined effect of the parameters is that TF activates O indirectly through M for both AM and FM input, and TF directly represses the expression of O for AM but not for FM input (B and C). (B and C were generated with , K1 = K2 = K3 = 0.01 and n1 = n2 = n3 = 4).

