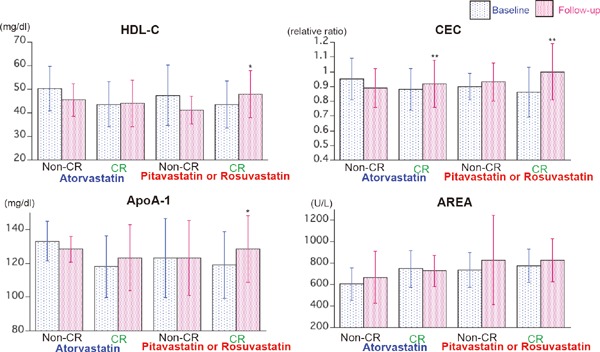
Fig. 2.

Comparison of HDL-C, ApoA-1, CEC, and AREA at baseline and follow-up period in patients treated with atorvastatin and those treated with rosuvastatin or pitavastatin in CR group who did not take any lipid-lowering drugs at baseline. *p < 0.05, **p < 0.01 compared with the baseline levels by paired t-test. Abbreviations as in text.
