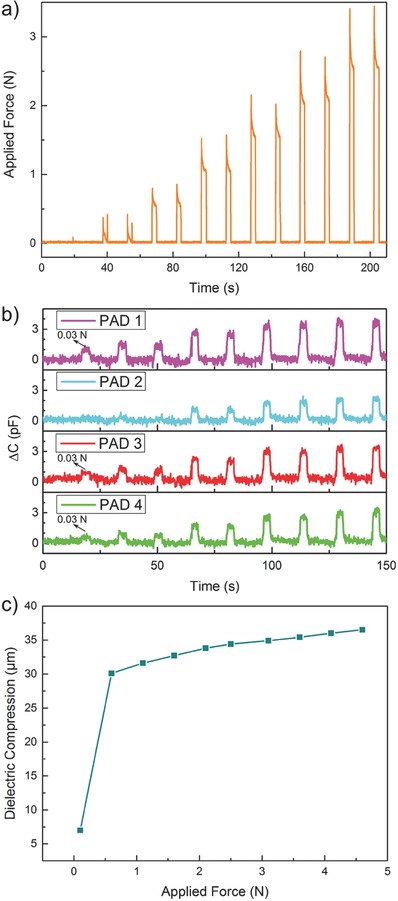
Figure 4.

Quantitative analysis of the tactile sensor response. a) Readout of the FT sensor showing force increments of 0.5 N from 0.1 N, two touches for each force value. b) Recorded responses from four taxels. Pink, green, and red were actually pressed by the setup plastic “fingertip” (actual surface ≈ 10 mm2) while the cyan one feel “crosstalk” due to the continuity of the dielectric material. Here, the maximum force applied is 2 N. c) Compression of dielectric versus applied force: after a rapid compression at low values of applied force the device shows a linear behavior. This highlights the existence of two concurring elasticity mechanisms and improves response of the device at low contact forces.
