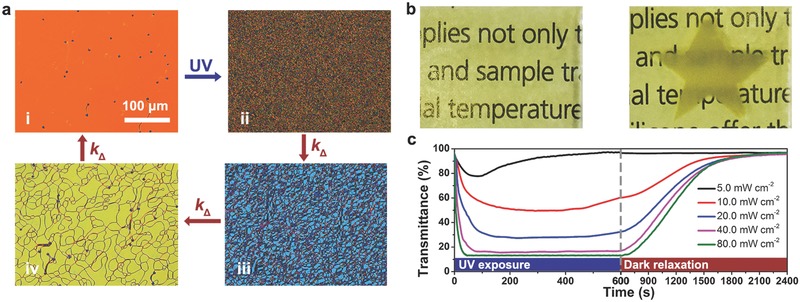
Figure 3.

Stimuli‐induced configurational transition of M1‐doped CLC (8.5 wt% M1 and 0.8 wt% S811 in SLC1717). a) POM images in reversible dynamic process: (i) planar reconfiguration, (ii) FC reconfiguration and (iii,iv) shrinking of the defect lines in dark relaxation. b) Photographs of the transparent state and the opaque state with a “star” pattern, respectively. c) Time‐resolved transmittance at 633 nm at different intensity of UV irradiation for 600 s and then dark relaxation at room temperature for 1800 s.
