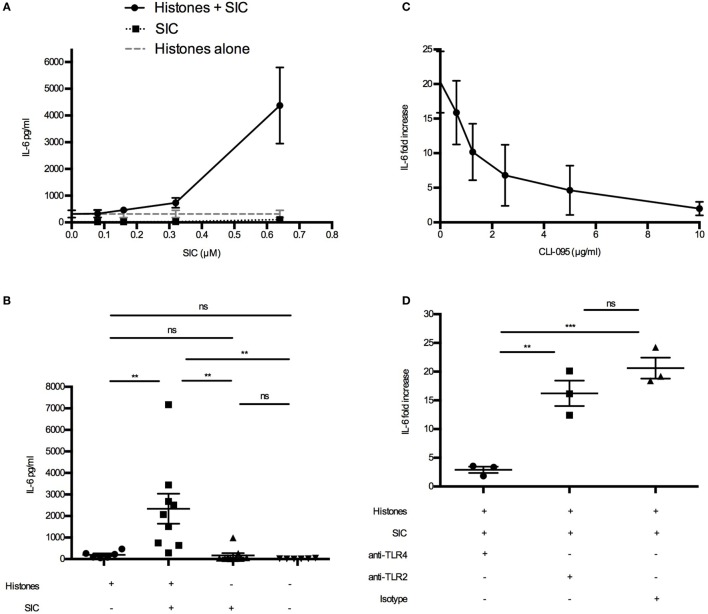
Figure 5.
SIC/histone complexes inducing IL-6 production via TLR4. (A) Heparinized blood was diluted 1:1 in PBS. Histones (50 µg/mL) and different concentrations of SIC were preincubated for 1 h and added to the blood. Samples were incubated for 7 h at 37°C and IL-6 was measured in the plasma SN. Data show mean ± SEM (n = 3). (B) Heparinized blood from six donors was investigated for IL-6 production after incubation with SIC/histone complexes for 7 h at 37°C. Data show mean ± SEM (one-way ANOVA, Tukey’s test). IL-6 production was measured in blood incubated with histones, SIC, and different concentrations of the TLR4 inhibitor CLI-095 (n = 3) (C) or anti-TLR4 antibodies (25 µg/mL) (n = 3), anti-TLR2 antibodies (25 µg/mL) (n = 3), or isotype control (25 µg/mL) (n = 3) (D). Values are expressed as fold increase to diluted blood stimulated with PBS. Data show mean ± SEM (one-way ANOVA, Tukey’s test). *P ≤ 0.05, **P ≤ 0.01, and ***P ≤ 0.001.

