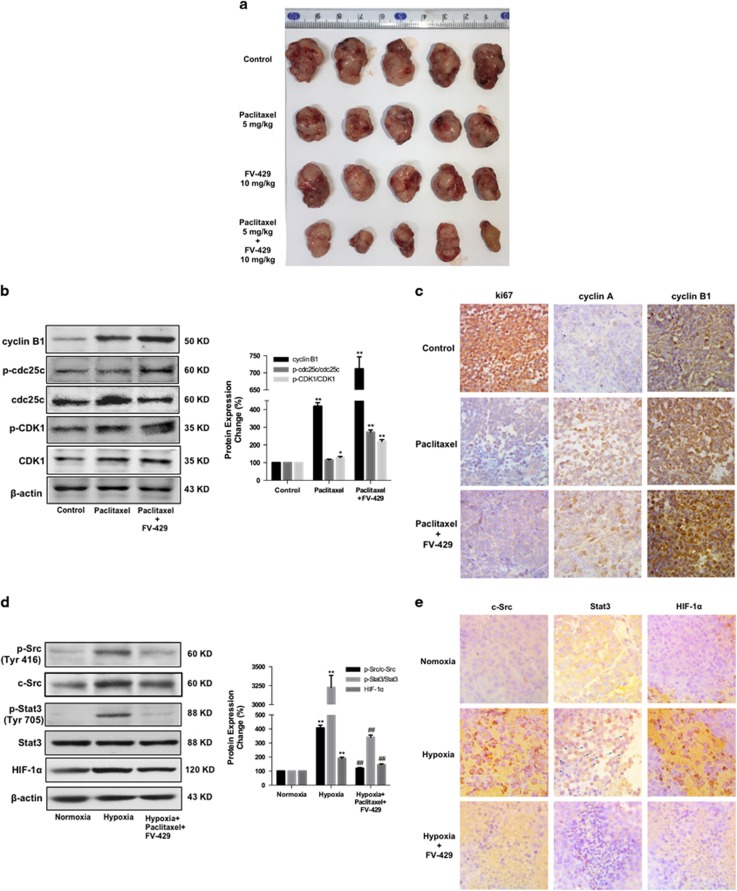
Figure 6.
Antixenografted tumor effect and reversal mechanism of FV-429 combined with paclitaxel in vivo. (a) Image of the resected xenografted tumors. (b) Expression of cylin B1, p-cdc25c, cdc25c, p-CDK1 and CDK1 in hypoxic regions of xenografted tumors detected by western blottings. Protein expression change was represented by densitometric analysis. The results are representative of three independent experiments and expressed as means±S.D., *P<0.05 and **P<0.01, compared with the control groups. (c) Expression of ki67, cylin A and cylin B1 in hypoxic regions of xenografted tumors detected by immunohistochemistry (× 400). (d) Expression of p-Src (Tyr 416), c-Src, p-Stat3 (Tyr 705), Stat3 and HIF-1α in normoxic and hypoxic regions of xenografted tumors detected by western blottings. Protein expression change was represented by densitometric analysis. The results are representative of three independent experiments and expressed as means±S.D., **P<0.01, compared with the normoxia control groups and ##P<0.01, compared with the hypoxia control groups. (e) Expression of c-Src, Stat3 and HIF-1α in normoxic and hypoxic regions detected by immunohistochemistry (× 400). Arrows referred to Stat3 nuclear translocation

