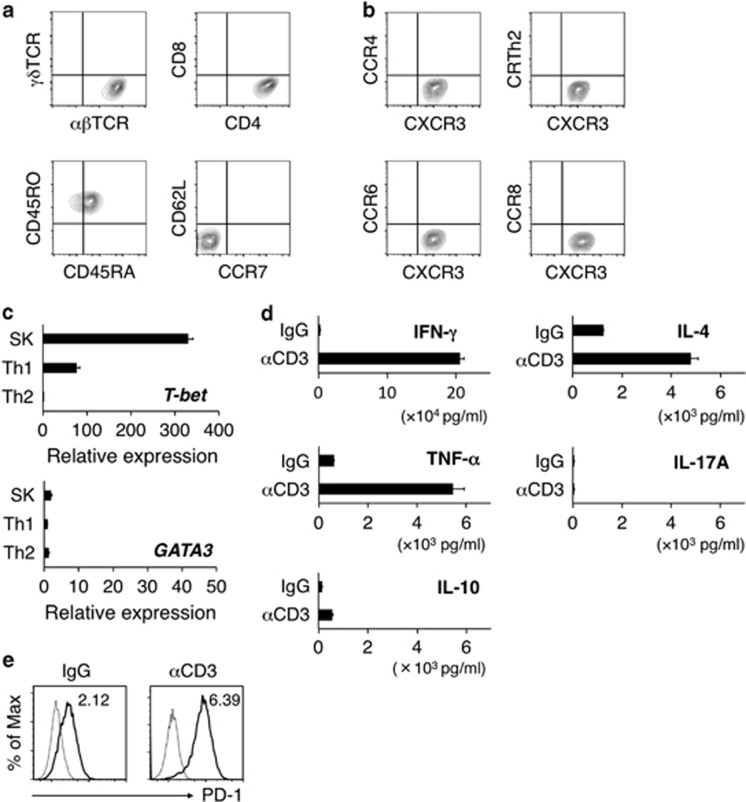
Figure 2.
Th1 phenotype of the b3a2-specific CD4+ T-cell clone. (a) Representative flow cytometry profiles of surface αβTCR, γδTCR, CD4, CD8, CD45RO, CD45RA, CD62L and CCR7 on SK cells. (b) Surface expression of chemokine receptors (CCR4, CXCR3, CRTh2, CCR6 and CCR8). (c) Expression of transcription factors involved in Th1 and Th2 differentiation. After SK cells were stimulated for 24 h with plate-bound anti-CD3 mAbs (10 μg/ml), T-bet and GATA3 mRNA levels were quantified. To induce the Th1 and Th2 cells used as controls, PBMCs were stimulated with plate-bound anti-CD3 mAbs (10 μg/ml) under Th1 conditions (IL-12 plus anti-IL-4 Ab) and Th2 conditions (IL-4 plus anti-IL-12 Ab), respectively. The mRNA amounts (shown in a.u.) are normalized relative to the GAPDH mRNA amount. (d) Cytokine production by SK cells after 48-h stimulation with plate-bound control IgG or anti-CD3 mAbs (10 μg/ml). (c, d) Data shown are means±s.d. of triplicate cultures and are representative of three independent triplicate experiments. (e) PD-1 expression on SK. SK cells were stimulated with plate-bound control IgG or anti-CD3 mAbs (10 μg/ml) for 24 h. Staining histograms of PD-1 (solid line) and isotype-matched controls (dotted line) are shown. RFI is shown in the upper part of each panel. IL, interleukin; IgG, immunoglobulin G; IFN, interferon; mAbs, monoclonal antibodies; mRNA, messenger RNA; PBMCs, peripheral blood mononuclear cells; RFI, relative fluorescence intensity; Th, T helper; TCR, T-cell receptor.

