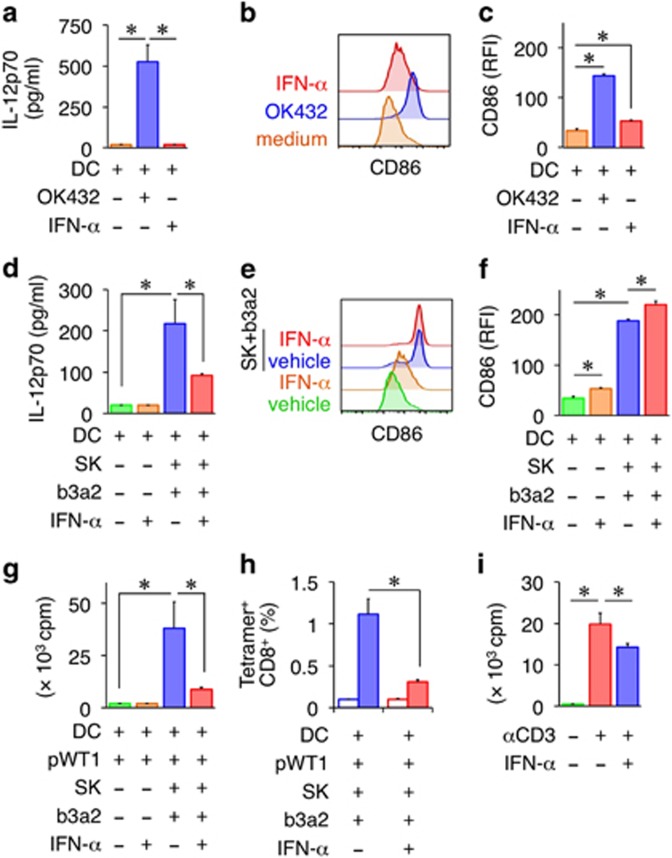
Figure 5.
Suppression of leukemia antigen-specific CTL responses by IFN-α. (a) Effect of IFN-α on IL-12p70 production by DCs. (b) Representative flow cytometry profiles of CD86 on DCs. DCs were cultured for 24 h in the presence or absence of IFN-α (1 ng/ml). (c) RFI values indicating CD86 expression. (a–c) OK432-matured DCs and medium-control DCs served as controls. (d) Effect of IFN-α on IL-12p70 production by SK-conditioned DCs. b3a2-peptide-loaded DCs were cultured with SK cells in the presence of IFN-α. (e) Representative flow cytometry profiles of CD86 on SK-conditioned DCs. Vehicle or b3a2 peptide DCs were cultured for 24 h with or without SK cells at a DC/SK ratio of 10:1 in the presence or absence of IFN-α. (f) RFI values indicating CD86 expression. (g) Proliferation of CD8+ T cells at day 7 in the WT1-specific CTL priming assay in the presence or absence of IFN-α was measured as [3H]-thymidine incorporation. (h) Frequency of WT1/HLA-A24-tetramer-positive CD8+ T cells (filled box) at day 10 in the WT1-specific CTL priming assay in the presence or absence of IFN-α. The HIV tetramer (open box) served as the control. (i) Proliferation of CD8+ T cells stimulated with plate-bound anti-CD3 mAbs in the presence of IFN-α. (a, c, d, f–i) Data are representative of three independent triplicate experiments. Error bars, s.d.; *P<0.05, one-way ANOVA. ANOVA, analysis of variance; b3a2, b3a2 peptide; CTL, cytotoxic T lymphocyte; DC, dendritic cell; IFN, interferon; mAbs, monoclonal antibodies; WT1, WT1 peptide; RFI, relative fluorescence intensity; WT1, Wilms tumor 1.

