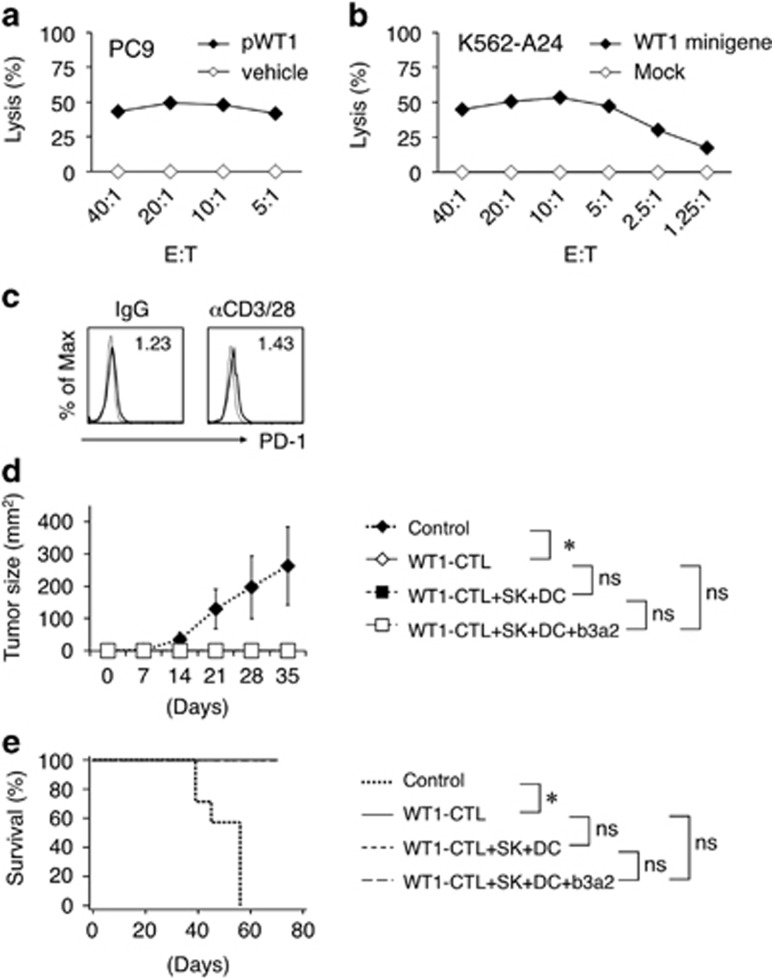
Figure 6.
Antileukemia activity of CTLs primed by SK-conditioned DCs. (a) Cytotoxic activities of expanded WT1-specific CD8+ T cells against an HLA-A24-positive cell line (PC9) loaded with vehicle or WT1 peptide. (b) Cytotoxic activities against K562-A24 cells that were mock transduced or transduced with a minigene encoding the HLA-A24-restricted WT1 epitope. (a, b) Cytotoxicity was measured at 4 h in 51Cr release assays at the indicated effector/target (E:T) ratios. Data are representative of three independent duplicate experiments. (c) Representative flow cytometry profiles of PD-1 on expanded WT1-specific CD8+ T cells. The CD8+ T cells were stimulated with soluble control IgG or anti-CD3 mAbs (1 μg/ml) plus anti-CD28 mAbs (1 μg/ml) for 24 h. Staining histograms of PD-1 (solid line) and isotype-matched controls (dotted line) are shown. RFI is shown in the upper part of each panel. (d) In vivo inhibition of leukemia. RJ mice were s.c. coinjected with mixtures of K562-A24-WT1 minigene cells and either saline or WT1-specific CTLs. Where indicated, mixtures of SK cells and DCs±b3a2 peptide were i.p. injected into mice at day −1. The average tumor size for each group from day 0 to day 35 is shown. Error bars, s.d.; *P<0.05, one-way ANOVA; NS (e) Kaplan–Meier survival curves plotted for treated and control mice. *P<0.05, log-rank (Mantel–Cox) test; NS. (WT1-CTL, n=8; WT1-CTL+SK+DC, n=8; WT1-CTL+SK+DC+b3a2, n=8; no treatment, n=7). ANOVA, analysis of variance; CTL, cytotoxic T lymphocyte; DC, dendritic cell; i.p., intraperitoneally; NS, not significant; s.c., subcutaneously; RFI, relative fluorescence intensity; WT1, Wilms tumor 1.

