
Figure 1.
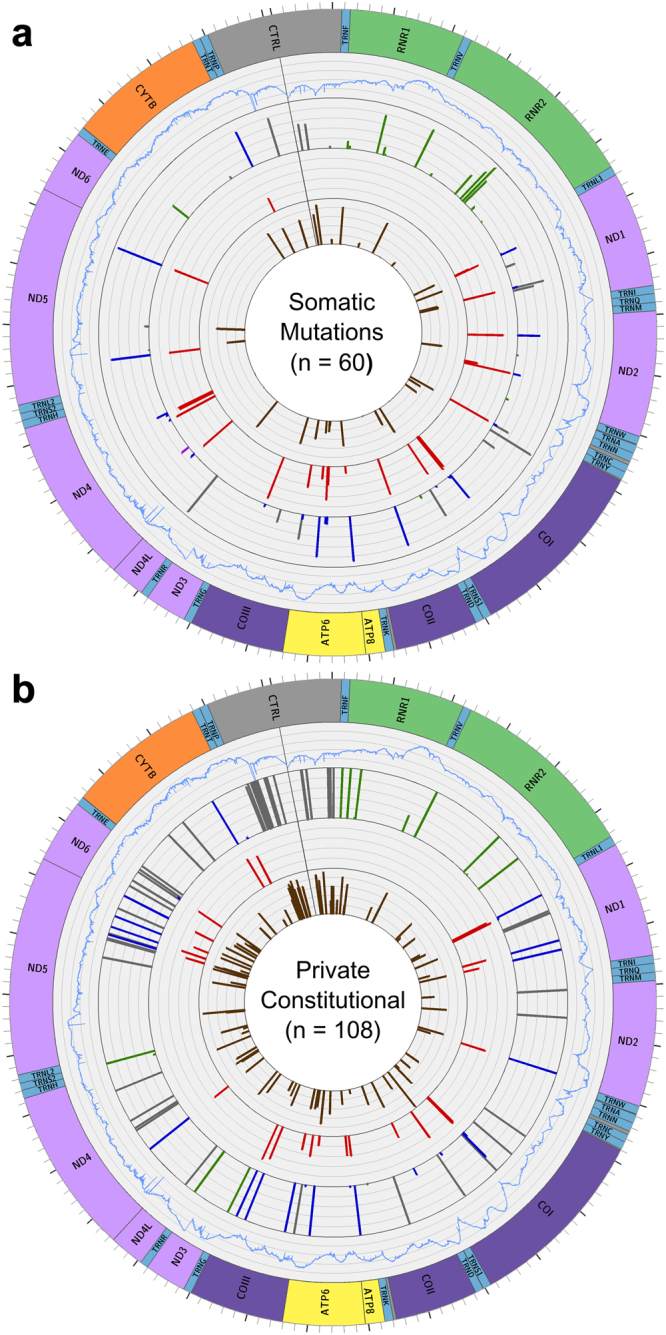
mtDNA variants in DLBCL. Graphs from periphery to center: (1) Map of the mitochondrial genome (2) Average sequence depth for each position among the samples carrying variants, ranging from 0 to 4000 reads. (3) SNVs found in DLBCL, with the height of each bar depicting the VAF. tRNA and rRNA variants are green, stop-gains are red, non-synonymous variants are blue, synonymous and non-coding variants are grey. (4) The MutPred pathogenicity score for each non-synonymous variant. (5) The log GenBank frequency of each variant, represented as 5 + log10(x/30589), where x is the number of genomes in GenBank that carry that variant. (a) Somatic Mutations in 29 samples. (b) Private constitutional variants in 34 samples.