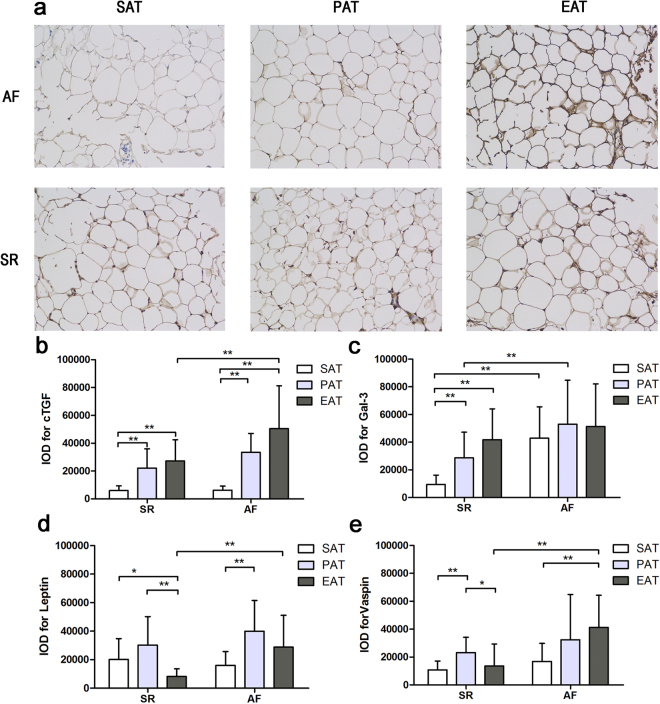
Figure 2.
Immunohistochemical integrated optical density analysis of adipokines in the adipose tissue of patients with AF (n = 16) and SR (n = 20). (a) Representative sections cTGF expression of SAT, PAT, and EAT in the AF and SR groups (×200); (b) Quantitative results of IOD in sections of cTGF in the AF and SR groups; (c) Quantitative results of IOD in sections of gal-3 in the AF and SR groups; (d) Quantitative results of IOD in sections of leptin in the AF and SR groups; (e) Quantitative results of IOD in sections of vaspin in the AF and SR groups. *P < 0.05, **P < 0.01.

